Walmart 2002 Annual Report Download - page 16
Download and view the complete annual report
Please find page 16 of the 2002 Walmart annual report below. You can navigate through the pages in the report by either clicking on the pages listed below, or by using the keyword search tool below to find specific information within the annual report.-
 1
1 -
2
-
3
-
4
-
5
-
 6
6 -
 7
7 -
 8
8 -
 9
9 -
 10
10 -
 11
11 -
 12
12 -
 13
13 -
 14
14 -
 15
15 -
 16
16 -
 17
17 -
 18
18 -
 19
19 -
 20
20 -
 21
21 -
 22
22 -
 23
23 -
 24
24 -
 25
25 -
 26
26 -
27
-
28
-
29
-
30
-
31
-
32
-
33
-
34
-
35
-
36
-
37
-
38
-
39
-
40
-
41
-
42
-
43
-
44
 |
 |

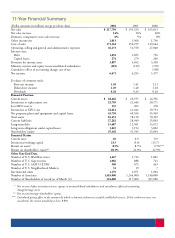
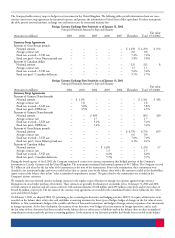
14
(Dollar amounts in millions except per share data)
2002
2001 2000
Net sales
$ 217,799
$ 191,329 $ 165,013
Net sales increase
14%
16% 20%
Domestic comparative store sales increase
6%
5% 8%
Other income-net
2,013
1,966 1,796
Cost of sales
171,562
150,255 129,664
Operating, selling and general and administrative expenses
36,173
31,550 27,040
Interest costs:
Debt
1,052
1,095 756
Capital leases
274
279 266
Provision for income taxes
3,897
3,692 3,338
Minority interest and equity in unconsolidated subsidiaries
(183)
(129) (170)
Cumulative effect of accounting change, net of tax
–
– (198)
Net income
6,671
6,295 5,377
Per share of common stock:
Basic net income
1.49
1.41 1.21
Diluted net income
1.49
1.40 1.20
Dividends
0.28
0.24 0.20
Financial Position
Current assets
$ 28,246
$ 26,555 $ 24,356
Inventories at replacement cost
22,749
21,644 20,171
Less LIFO reserve
135
202 378
Inventories at LIFO cost
22,614
21,442 19,793
Net property, plant and equipment and capital leases
45,750
40,934 35,969
Total assets
83,451
78,130 70,349
Current liabilities
27,282
28,949 25,803
Long-term debt
15,687
12,501 13,672
Long-term obligations under capital leases
3,045
3,154 3,002
Shareholders’ equity
35,102
31,343 25,834
Financial Ratios
Current ratio
1.0
0.9 0.9
Inventories/working capital
23.5
(9.0) (13.7)
Return on assets*
8.5%
8.7% 9.5%***
Return on shareholders’ equity**
20.1%
22.0% 22.9%
Other Year-End Data
Number of U.S. Wal-Mart stores
1,647
1,736 1,801
Number of U.S. Supercenters
1,066
888 721
Number of U.S. SAM’S CLUBS
500
475 463
Number of U.S. Neighborhood Markets
31
19 7
International units
1,170
1,071 1,004
Number of Associates
1,383,000
1,244,000 1,140,000
Number of Shareholders of record (as of March 31)
324,000
317,000 307,000
* Net income before minority interest, equity in unconsolidated subsidiaries and cumulative effect of accounting
change/average assets
** Net income/average shareholders’ equity
*** Calculated giving effect to the amount by which a lawsuit settlement exceeded established reserves. If this settlement were not
considered, the return would have been 9.8%.
11-Year Financial Summary