Walmart 2002 Annual Report Download - page 19
Download and view the complete annual report
Please find page 19 of the 2002 Walmart annual report below. You can navigate through the pages in the report by either clicking on the pages listed below, or by using the keyword search tool below to find specific information within the annual report.-
 1
1 -
2
-
3
-
4
-
5
-
6
-
7
-
8
-
 9
9 -
 10
10 -
 11
11 -
 12
12 -
 13
13 -
 14
14 -
 15
15 -
 16
16 -
 17
17 -
 18
18 -
 19
19 -
 20
20 -
 21
21 -
 22
22 -
 23
23 -
 24
24 -
 25
25 -
 26
26 -
 27
27 -
 28
28 -
 29
29 -
30
-
31
-
32
-
33
-
34
-
35
-
36
-
37
-
38
-
39
-
40
-
41
-
42
-
43
-
44
 |
 |

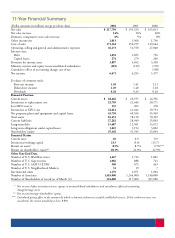
17
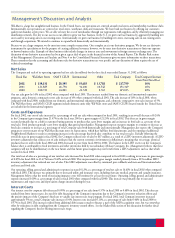
Net Income
In fiscal 2002, we earned net income of $6,671 billion, a 6.0% increase over the aggregate net income of the Company in fiscal 2001. Our net income
did not grow in fiscal 2002 by the same percentage as our total net sales grew in fiscal 2002 largely as a result of the reduction in the overall gross
margin and increased costs and expenses of the Company in fiscal 2002 as discussed above. In fiscal 2001, we earned net income of $6,295 billion, a
17.1% increase over the Company’s net income in 2000. This increase resulted primarily from the growth in the Company’s total net sales and a slight
improvement in the Company’s overall gross margin.
During July 2001, we acquired the outstanding minority interest in Wal-Mart.com, Inc. from Accel Partners and a small group of other investors.
A reorganization resulting from the acquisition resulted in a charge against the earnings of the Company during fiscal 2002 of slightly less than
$0.01 per share.
Wal-Mart Stores Segment
Segment sales increase Segment operating Segment operating income Operating income as a
Fiscal year from prior fiscal year income (in billions) increase from prior year percentage of segment sales
2002 14.1% $ 10.3 6.0% 7.4%
2001 12.1% 9.7 11.5% 8.0%
2000 14.0% 8.7 20.2% 8.0%
The Wal-Mart Stores segment sales amounted to 63.9% of total Company sales in fiscal 2002, which compares to 63.7% and 65.9% in fiscal 2001 and
2000, respectively.
The segment sales increases in fiscal 2002 and fiscal 2001 from the prior fiscal years resulted from comparative store sales increases and our expansion
program in the Wal-Mart Stores segment. Segment expansion during fiscal 2002 included the opening of 33 Wal-Mart stores, 12 Neighborhood
Markets and 178 Supercenters (including the conversion of 121 existing Wal-Mart stores into Supercenters). Segment expansion during fiscal 2001
included the opening of 41 Wal-Mart stores, 12 Neighborhood Markets and 167 Supercenters (including the conversion of 104 existing Wal-Mart
stores into Supercenters).
A reduction in gross margin and an increase in operating expenses caused the decrease in segment operating income as a percent of segment sales in
fiscal 2002. The gross margin reduction was driven primarily by an increase in lower-margin food sales as a percentage of total segment sales, a change
in customer buying patterns to lower-margin merchandise and competitive pressures. Segment expenses in fiscal 2002 as a percent of sales were higher
than fiscal 2001 due primarily to increased Associate wages, utility, repairs and maintenance expenses and insurance costs. The increase in segment
operating income for fiscal 2001 was driven by margin improvements that resulted from decreased markdowns and improved inventory shrinkage
experience during the fiscal year. Offsetting these margin improvements were increased distribution costs, resulting from higher fuel, utility and
payroll charges and overall payroll costs that were higher as a percentage of fiscal 2001 sales which were adversely affected by a fiscal 2001 holiday
season with lower than anticipated sales. Operating income information for fiscal years 2000 and 2001 has been reclassified to conform to the current
year presentation.
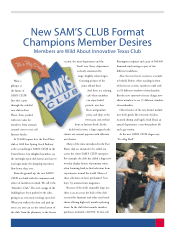
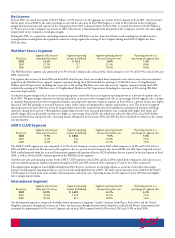
SAM’S CLUB Segment
Segment sales increase Segment operating Segment operating income Operating income as a
Fiscal year from prior fiscal year income (in billions) increase from prior year percentage of segment sales
2002 9.7% $ 1,028 9.1% 3.5%
2001 8.1% 942 10.8% 3.5%
2000 8.4% 850 22.7% 3.4%
The SAM’S CLUB segment net sales amounted to 13.5% of total Company net sales in fiscal 2002, which compares to 14.0% and 15.0% in fiscal
2001 and 2000, respectively. The decrease in this segment’s sales as a percent of total Company sales in fiscal 2002 and 2001 when compared to fiscal
2000 resulted primarily from the increased International segment sales generated by our ASDA subsidiary that we acquired in the third quarter of fiscal
2000, as well as, for fiscal 2002, domestic growth in the Wal-Mart Stores segment.
Growth in net sales and operating income for the SAM’S CLUB segment in fiscal 2002 and fiscal 2001 resulted from comparative club sales increases
and our expansion program. Segment expansion during fiscal 2002 and 2001 consisted of the opening of 25 and 13 new clubs, respectively.
This segment gross margin increased slightly during fiscal 2002; however, an increase in operating expense as a percent of sales offset this margin
increase, leaving segment operating income as a percent of sales unchanged from fiscal 2001. The main expense pressures in fiscal 2002 in the SAM’S
CLUB segment occurred in the areas of utility and maintenance and repair costs. Operating income for the segment in fiscal 2001 increased slightly
due to margin improvements.
International Segment
Segment sales increase Segment operating Segment operating income Operating income as a
Fiscal year from prior fiscal year income (in billions) increase from prior year percentage of segment sales
2002 10.5% $ 1,458 31.1% 4.1%
2001 41.2% 1,112 36.1% 3.5%
2000 85.6% 817 48.8% 3.6%
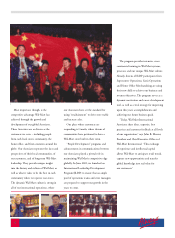
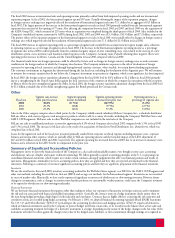
Our International segment is comprised of wholly-owned operations in Argentina, Canada, Germany, South Korea, Puerto Rico and the United
Kingdom; operations through joint ventures in China; and operations through majority-owned subsidiaries in Brazil and Mexico. International sales
accounted for approximately 16.3% of total Company sales in fiscal 2002 compared with 16.8% in fiscal 2001 and 13.8% in fiscal 2000.