Walmart 2002 Annual Report Download - page 39
Download and view the complete annual report
Please find page 39 of the 2002 Walmart annual report below. You can navigate through the pages in the report by either clicking on the pages listed below, or by using the keyword search tool below to find specific information within the annual report.-
 1
1 -
2
-
3
-
4
-
5
-
6
-
7
-
8
-
9
-
10
-
11
-
12
-
13
-
14
-
15
-
16
-
17
-
18
-
19
-
20
-
21
-
22
-
23
-
24
-
25
-
26
-
27
-
28
-
 29
29 -
 30
30 -
 31
31 -
 32
32 -
 33
33 -
 34
34 -
 35
35 -
 36
36 -
 37
37 -
 38
38 -
 39
39 -
 40
40 -
 41
41 -
 42
42 -
 43
43 -
 44
44
 |
 |

37
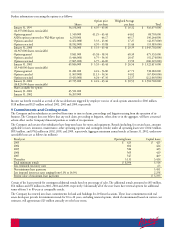
Further information concerning the options is as follows:
Option price Weighted Average
Shares per share per share Total
January 31, 1999 56,158,000 $ 4.39 – 43.00 $ 16.32 $ 916,675,000
(12,357,000 shares exerciseable)
Options granted 1,540,000 41.25 – 63.44 44.62 68,703,000
ASDA options converted to Wal-Mart options 4,250,000 46.17 46.17 196,244,000
Options canceled (2,452,000) 5.33 – 43.00 17.27 (42,337,000)
Options exercised (8,182,000) 4.39 – 39.88 11.44 (93,583,000)
January 31, 2000 51,314,000 $ 5.33 – 63.44 $ 20.39 $ 1,045,702,000
(12,967,000 shares exerciseable)
Options granted 9,841,000 45.38 – 58.94 48.30 475,332,000
Options canceled (3,444,000) 6.75 – 54.56 26.47 (92,274,000)
Options exercised (7,865,000) 6.75 – 46.00 13.50 (106,145,000)
January 31, 2001 49,846,000 $ 5.33 – 63.44 $ 26.56 $ 1,322,615,000
(15,944,000 shares exerciseable)
Options granted 11,281,000 4.24 – 56.80 47.71 538,182,000
Options canceled (1,969,000) 11.13 – 54.56 34.02 (67,030,000)
Options exercised (9,433,000) 4.24 – 47.56 22.37 (212,065,000)
January 31, 2002 49,725,000 $ 4.24 – 63.44 $ 30.53 $ 1,581,702,000
(16,823,000 shares exerciseable)
Shares available for option:
January 31, 2001 65,521,000
January 31, 2002 56,209,000
Income tax benefit recorded as a result of the tax deductions triggered by employee exercise of stock options amounted to $106 million,
$118 million and $125 million in fiscal 2002, 2001 and 2000, respectively.
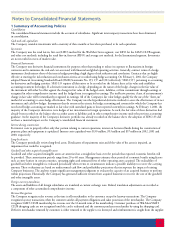
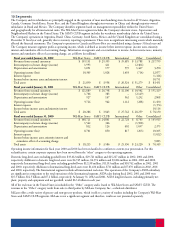
9 Commitments and Contingencies
The Company and its subsidiaries are involved from time to time in claims, proceedings and litigation arising from the operation of its
business. The Company does not believe that any such claim, proceeding or litigation, either alone or in the aggregate, will have a material
adverse effect on the Company’s financial position or results of its operations.
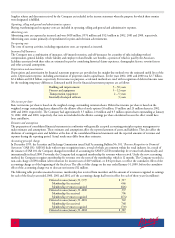
The Company and certain of its subsidiaries have long-term leases for stores and equipment. Rentals (including, for certain leases, amounts
applicable to taxes, insurance, maintenance, other operating expenses and contingent rentals) under all operating leases were $1,043 million,
$893 million, and $762 million in 2002, 2001, and 2000, respectively. Aggregate minimum annual rentals at January 31, 2002, under non-
cancelable leases are as follows (in millions):
Fiscal year Operating leases Capital leases
2003 $ 623 $ 425
2004 602 424
2005 586 423
2006 565 419
2007 547 409
Thereafter 5,131 3,414
Total minimum rentals $ 8,054 5,514
Less estimated executory costs 63
Net minimum lease payments 5,451
Less imputed interest at rates ranging from 6.1% to 14.0% 2,258
Present value of minimum lease payments $ 3,193
Certain of the leases provide for contingent additional rentals based on percentage of sales. The additional rentals amounted to $63 million,
$56 million and $51 million in 2002, 2001 and 2000, respectively. Substantially all of the store leases have renewal options for additional
terms of from 5 to 80 years at comparable rentals.
The Company has entered into lease commitments for land and buildings for 20 future locations. These lease commitments with real
estate developers provide for minimum rentals for 10 to 20 years, excluding renewal options, which if consummated based on current cost
estimates, will approximate $25 million annually over the lease terms.