Walmart 2002 Annual Report Download - page 37
Download and view the complete annual report
Please find page 37 of the 2002 Walmart annual report below. You can navigate through the pages in the report by either clicking on the pages listed below, or by using the keyword search tool below to find specific information within the annual report.-
 1
1 -
2
-
3
-
4
-
5
-
6
-
7
-
8
-
9
-
10
-
11
-
12
-
13
-
14
-
15
-
16
-
17
-
18
-
19
-
20
-
21
-
22
-
23
-
24
-
25
-
26
-
 27
27 -
 28
28 -
 29
29 -
 30
30 -
 31
31 -
 32
32 -
 33
33 -
 34
34 -
 35
35 -
 36
36 -
 37
37 -
 38
38 -
 39
39 -
 40
40 -
 41
41 -
 42
42 -
 43
43 -
 44
44
 |
 |

Items that give rise to significant portions of the deferred tax accounts at January 31 are as follows (in millions):
2002 2001 2000
Deferred tax liabilities
Property, plant, and equipment $ 906 $ 751 $ 748
Inventory 368 407 393
International, principally asset basis difference 448 398 348
Acquired asset basis difference 53 65 314
Other 138 87 66
Total deferred tax liabilities 1,913 1,708 1,869
Deferred tax assets
Amounts accrued for financial reporting purposes
not yet deductible for tax purposes 832 865 1,098
Capital leases 26 74 193
International, asset basis and loss carryforwards 459 352 402
Deferred revenue 137 142 181
Other 159 153 215
Total deferred tax assets 1,613 1,586 2,089
Net deferred tax liabilities (assets) $ 300 $ 122 $ (220)
A reconciliation of the significant differences between the effective income tax rate and the federal statutory rate on pretax income follows:
Fiscal years ended January 31, 2002 2001 2000
Statutory tax rate 35.00% 35.00% 35.00%
State income taxes, net of federal income tax benefit 1.98% 2.13% 2.18%
International (1.01%) (0.84%) (0.74%)
Other 0.28% 0.21% 0.31%
36.25% 36.50% 36.75%
Federal and state income taxes have not been provided on accumulated but undistributed earnings of certain foreign subsidiaries aggregating
approximately $1 billion at January 31, 2002, as such earnings have been reinvested in the business. The determination of the amount of the
unrecognized deferred tax liability related to the undistributed earnings is not practicable.
7 Acquisitions
In fiscal 2001, the Company purchased 271.3 million shares of stock in Wal-Mart de Mexico S.A. de C.V. (formerly Cifra S.A. de C.V.)
at a total cash cost of $587 million. This transaction increased the Company’s ownership percentage by approximately 6% and resulted in
goodwill of $422 million, which was amortized over a 40-year life. Beginning in the first quarter of fiscal 2003, goodwill and intangible
assets deemed to have indefinite lives will no longer be amortized but will be subject to annual impairment tests under FASB Standard 142.
See Note 1 of Notes to Consolidated Financial Statements for additional information on New Accounting Pronouncements.
In December 1999, the Company acquired most of the minority interest of its operation in South Korea from its joint venture partner with
the remaining minority interest being acquired during the first quarter of fiscal 2001.
During the third quarter of fiscal 2000, the Company acquired ASDA Group PLC (ASDA), the third-largest retailer in the United Kingdom
with 229 stores. The transaction was accounted for as a purchase. The results of operations are included in the consolidated Company results
since the date of acquisition. The purchase price of approximately $11 billion was allocated to the net assets acquired and liabilities assumed
based on their estimated fair value. The resulting goodwill and other acquired intangible assets of approximately $7 billion are being
amortized over 40 years prior to the adoption of FASB 142.
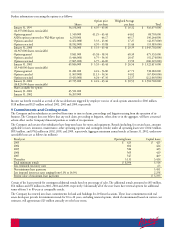
The following table presents unaudited pro forma results as if the ASDA acquisition had occurred at the beginning of the fiscal year ended
January 31, 2000. Adjustments to net income are primarily related to the amortization of goodwill and other acquired intangible assets and
additional interest expense on the debt incurred to finance the acquisition. The ASDA results were converted from Great Britain pounds to
United States dollars at the average exchange rate for the period presented. The conversion rates range from 1.61 to 1.66. The aggregate
impact of other acquisitions in this period are not presented due to the insignificant differences from historical results (amounts in millions
except per share data):
Fiscal years ended January 31, 2000
Sales $ 172,295
Net income $ 5,551
Net income per share – basic $ 1.25
Net income per share – diluted $ 1.24
35