Walmart 2002 Annual Report Download - page 29
Download and view the complete annual report
Please find page 29 of the 2002 Walmart annual report below. You can navigate through the pages in the report by either clicking on the pages listed below, or by using the keyword search tool below to find specific information within the annual report.-
 1
1 -
2
-
3
-
4
-
5
-
6
-
7
-
8
-
9
-
10
-
11
-
12
-
13
-
14
-
15
-
16
-
17
-
18
-
 19
19 -
 20
20 -
 21
21 -
 22
22 -
 23
23 -
 24
24 -
 25
25 -
 26
26 -
 27
27 -
 28
28 -
 29
29 -
 30
30 -
 31
31 -
 32
32 -
 33
33 -
 34
34 -
 35
35 -
 36
36 -
 37
37 -
 38
38 -
 39
39 -
40
-
41
-
42
-
43
-
44
 |
 |

27
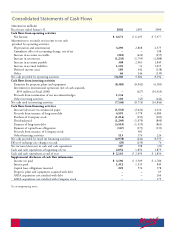
(Amounts in millions)
Fiscal years ended January 31, 2002 2001 2000
Cash flows from operating activities
Net Income $ 6,671 $ 6,295 $ 5,377
Adjustments to reconcile net income to net cash
provided by operating activities:
Depreciation and amortization 3,290 2,868 2,375
Cumulative effect of accounting change, net of tax ––198
Increase in accounts receivable (210) (422) (255)
Increase in inventories (1,235) (1,795) (2,088)
Increase in accounts payable 368 2,061 1,849
Increase in accrued liabilities 1,125 11 1,015
Deferred income taxes 185 342 (138)
Other 66 244 (139)
Net cash provided by operating activities 10,260 9,604 8,194
Cash flows from investing activities
Payments for property, plant and equipment (8,383) (8,042) (6,183)
Investment in international operations (net of cash acquired,
$195 million in Fiscal 2000) –(627) (10,419)
Proceeds from termination of net investment hedges 1,134 ––
Other investing activities 103 (45) (244)
Net cash used in investing activities (7,146) (8,714) (16,846)
Cash flows from financing activities
Increase/(decrease) in commercial paper (1,533) (2,022) 4,316
Proceeds from issuance of long-term debt 4,591 3,778 6,000
Purchase of Company stock (1,214) (193) (101)
Dividends paid (1,249) (1,070) (890)
Payment of long-term debt (3,519) (1,519) (863)
Payment of capital lease obligations (167) (173) (133)
Proceeds from issuance of Company stock –581 –
Other financing activities 113 176 224
Net cash provided by (used in) financing activities (2,978) (442) 8,553
Effect of exchange rate changes on cash (29) (250) 76
Net increase/(decrease) in cash and cash equivalents 107 198 (23)
Cash and cash equivalents at beginning of year 2,054 1,856 1,879
Cash and cash equivalents at end of year $ 2,161 $ 2,054 $ 1,856
Supplemental disclosure of cash flow information
Income tax paid $ 3,196 $ 3,509 $ 2,780
Interest paid 1,312 1,319 849
Capital lease obligations incurred 225 576 378
Property, plant and equipment acquired with debt ––65
ASDA acquisition cost satisfied with debt ––264
ASDA acquisition cost satisfied with Company stock ––175
See accompanying notes.
Consolidated Statements of Cash Flows