Walmart 2002 Annual Report Download - page 17
Download and view the complete annual report
Please find page 17 of the 2002 Walmart annual report below. You can navigate through the pages in the report by either clicking on the pages listed below, or by using the keyword search tool below to find specific information within the annual report.-
 1
1 -
2
-
3
-
4
-
5
-
6
-
 7
7 -
 8
8 -
 9
9 -
 10
10 -
 11
11 -
 12
12 -
 13
13 -
 14
14 -
 15
15 -
 16
16 -
 17
17 -
 18
18 -
 19
19 -
 20
20 -
 21
21 -
 22
22 -
 23
23 -
 24
24 -
 25
25 -
 26
26 -
 27
27 -
28
-
29
-
30
-
31
-
32
-
33
-
34
-
35
-
36
-
37
-
38
-
39
-
40
-
41
-
42
-
43
-
44
 |
 |

15
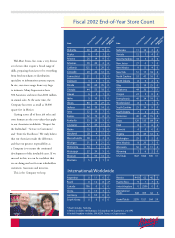
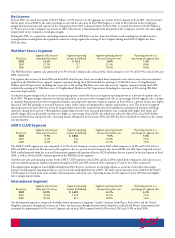
1999 1998 1997 1996 1995 1994 1993 1992
$ 137,634 $ 117,958 $ 104,859 $ 93,627 $ 82,494 $ 67,344 $ 55,484 $ 43,887
17% 12% 12% 13% 22% 21% 26% 35%
9% 6% 5% 4% 7% 6% 11% 10%
1,574 1,341 1,319 1,146 914 645 497 404
108,725 93,438 83,510 74,505 65,586 53,444 44,175 34,786
22,363 19,358 16,946 15,021 12,858 10,333 8,321 6,684
529 555 629 692 520 331 143 113
268 229 216 196 186 186 180 153
2,740 2,115 1,794 1,606 1,581 1,358 1,171 945
(153) (78) (27) (13) 4 (4) 4 (1)
––––––––
4,430 3,526 3,056 2,740 2,681 2,333 1,995 1,609
0.99 0.78 0.67 0.60 0.59 0.51 0.44 0.35
0.99 0.78 0.67 0.60 0.59 0.51 0.44 0.35
0.16 0.14 0.11 0.10 0.09 0.07 0.05 0.04
$ 21,132 $ 19,352 $ 17,993 $ 17,331 $ 15,338 $ 12,114 $ 10,198 $ 8,575
17,549 16,845 16,193 16,300 14,415 11,483 9,780 7,857
473 348 296 311 351 469 512 473
17,076 16,497 15,897 15,989 14,064 11,014 9,268 7,384
25,973 23,606 20,324 18,894 15,874 13,176 9,793 6,434
49,996 45,384 39,604 37,541 32,819 26,441 20,565 15,443
16,762 14,460 10,957 11,454 9,973 7,406 6,754 5,004
6,908 7,191 7,709 8,508 7,871 6,156 3,073 1,722
2,699 2,483 2,307 2,092 1,838 1,804 1,772 1,556
21,112 18,503 17,143 14,756 12,726 10,753 8,759 6,990
1.3 1.3 1.6 1.5 1.5 1.6 1.5 1.7
3.9 3.4 2.3 2.7 2.6 2.3 2.7 2.1
9.6% 8.5% 7.9% 7.8% 9.0% 9.9% 11.1% 12.0%
22.4% 19.8% 19.2% 19.9% 22.8% 23.9% 25.3% 26.0%
1,869 1,921 1,960 1,995 1,985 1,950 1,848 1,714
564 441 344 239 147 72 34 10
451 443 436 433 426 417 256 208
4–––––––
715 601 314 276 226 24 10 –
910,000 825,000 728,000 675,000 622,000 528,000 434,000 371,000
261,000 246,000 257,000 244,000 259,000 258,000 181,000 150,000
Years prior to 1998 have not been restated for the effects of the change in accounting method for SAM’S CLUB membership revenue
recognition as the effects of this change would not have a material impact on this summary. Therefore, pro forma information as if the
accounting change had been in effect for all years presented has not been provided.
The acquisition of the ASDA Group PLC and the Company’s related debt issuance had a significant impact on the fiscal 2000 amounts
in this summary. See Note 7 to the Consolidated Financial Statements.