Walmart 2004 Annual Report Download - page 18
Download and view the complete annual report
Please find page 18 of the 2004 Walmart annual report below. You can navigate through the pages in the report by either clicking on the pages listed below, or by using the keyword search tool below to find specific information within the annual report.-
 1
1 -
2
-
3
-
4
-
5
-
6
-
7
-
 8
8 -
 9
9 -
 10
10 -
 11
11 -
 12
12 -
 13
13 -
 14
14 -
 15
15 -
 16
16 -
 17
17 -
 18
18 -
 19
19 -
 20
20 -
 21
21 -
 22
22 -
 23
23 -
 24
24 -
 25
25 -
 26
26 -
 27
27 -
 28
28 -
29
-
30
-
31
-
32
-
33
-
34
-
35
-
36
-
37
-
38
-
39
-
40
-
41
-
42
-
43
-
44
-
45
-
46
-
47
-
48
-
49
-
50
-
51
-
52
-
53
-
54
-
55
-
56
-
57
-
58
-
59
-
60
 |
 |

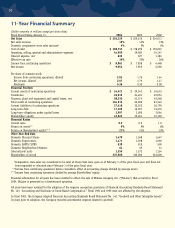
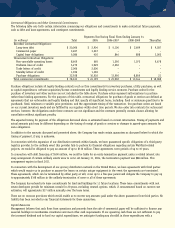
11-Year Financial Summary
(Dollar amounts in millions except per share data)
Fiscal Years Ending January 31, 2004 2003 2002
Net Sales $ 256,329 $ 229,616 $ 204,011
Net sales increase 12% 13% 13%
Domestic comparative store sales increase* 4% 5% 6%
Cost of sales $ 198,747 $ 178,299 $ 159,097
Operating, selling, general and administrative expenses 44,909 39,983 35,147
Interest expense, net 832 927 1,183
Effective tax rate 36% 35% 36%
Income from continuing operations $ 8,861 $ 7,818 $ 6,448
Net income 9,054 7,955 6,592
Per share of common stock:
Income from continuing operations, diluted 2.03 1.76 1.44
Net income, diluted 2.07 1.79 1.47
Dividends 0.36 0.30 0.28
Financial Position
Current assets of continuing operations $ 34,421 $ 29,543 $ 26,615
Inventories 26,612 24,401 22,053
Property, plant and equipment and capital leases, net 58,530 51,374 45,248
Total assets of continuing operations 104,912 92,900 81,549
Current liabilities of continuing operations 37,418 32,225 26,795
Long-term debt 17,102 16,597 15,676
Long-term obligations under capital leases 2,997 3,000 3,044
Shareholders’ equity 43,623 39,461 35,192
Financial Ratios
Current ratio 0.9 0.9 1.0
Return on assets** 9% 9% 8%
Return on Shareholders’ equity*** 21% 21% 19%
Other Year-End Data
Domestic Discount Stores 1,478 1,568 1,647
Domestic Supercenters 1,471 1,258 1,066
Domestic SAM’S CLUBS 538 525 500
Domestic Neighborhood Markets 64 49 31
International units 1,355 1,272 1,154
Shareholders of record 335,000 330,000 324,000
*Comparative store sales are considered to be sales at stores that were open as of February 1 of the prior fiscal year and have not
been expanded or relocated since February 1 of the prior fiscal year.
**Income from continuing operations before cumulative effect of accounting change divided by average assets.
***Income from continuing operations divided by average Shareholders’ equity.
Financial information for all years has been restated to reflect the sale of McLane Company, Inc. (“McLane”) that occurred in fiscal
2004. McLane is presented as a discontinued operation.
All years have been restated for the adoption of the expense recognition provisions of Financial Accounting Standards Board Statement
No. 123, “Accounting and Disclosure of Stock-Based Compensation.” Fiscal 1994 and 1995 were not affected by the adoption.
In fiscal 2003, the Company adopted Financial Accounting Standards Board Statement No. 142, “Goodwill and Other Intangible Assets.”
In years prior to adoption, the Company recorded amortization expense related to goodwill.
16