Walmart 2004 Annual Report Download - page 53
Download and view the complete annual report
Please find page 53 of the 2004 Walmart annual report below. You can navigate through the pages in the report by either clicking on the pages listed below, or by using the keyword search tool below to find specific information within the annual report.-
 1
1 -
2
-
3
-
4
-
5
-
6
-
7
-
8
-
9
-
10
-
11
-
12
-
13
-
14
-
15
-
16
-
17
-
18
-
19
-
20
-
21
-
22
-
23
-
24
-
25
-
26
-
27
-
28
-
29
-
30
-
31
-
32
-
33
-
34
-
35
-
36
-
37
-
38
-
39
-
40
-
41
-
42
-
 43
43 -
 44
44 -
 45
45 -
 46
46 -
 47
47 -
 48
48 -
 49
49 -
 50
50 -
 51
51 -
 52
52 -
 53
53 -
 54
54 -
 55
55 -
 56
56 -
 57
57 -
 58
58 -
 59
59 -
 60
60
 |
 |

51
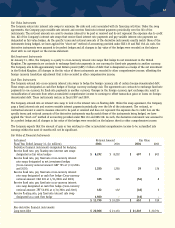
The Company measures segment profit as operating profit, which is defined as operating income, which is defined as income from
continuing operations before net interest expense, income taxes and minority interest. Information on segments and the reconciliation
to income from continuing operations before income taxes and minority interest, are as follows (in millions):
Fiscal Year Ended January 31, 2004 Wal-Mart Stores SAM’S CLUB International Other Consolidated
Revenues from external customers $ 174,220 $ 34,537 $ 47,572 $ – $ 256,329
Intercompany real estate charge (income) 2,468 484 – (2,952) –
Depreciation and amortization 1,482 249 810 1,311 3,852
Operating income (loss) 12,916 1,126 2,370 (1,387) 15,025
Interest expense, net (832)
Income from continuing operations
before income taxes and
minority interest 14,193
Total assets of continuing operations $ 26,230 $ 4,645 $ 34,018 $ 40,019 $ 104,912
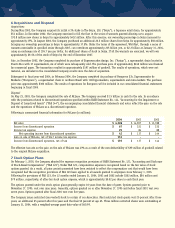
Fiscal Year Ended January 31, 2003 Wal-Mart Stores SAM’S CLUB International Other Consolidated
Revenues from external customers $ 157,120 $ 31,702 $ 40,794 $ – $ 229,616
Intercompany real estate charge (income) 2,228 453 – (2,681) –
Depreciation and amortization 1,287 216 639 1,222 3,364
Operating income (loss) 11,840 1,023 1,998 (1,566) 13,295
Interest expense, net (927)
Income from continuing operations
before income taxes and
minority interest 12,368
Total assets of continuing operations $ 24,748 $ 4,404 $ 30,709 $ 33,039 $ 92,900
Fiscal Year Ended January 31, 2002 Wal-Mart Stores SAM’S CLUB International Other Consolidated
Revenues from external customers $ 139,131 $ 29,395 $ 35,485 $ – $ 204,011
Intercompany real estate charge (income) 1,993 411 – (2,404) –
Depreciation and amortization 1,091 177 595 1,365 3,228
Operating income (loss) 10,189 1,023 1,271 (904) 11,579
Interest expense, net (1,183)
Income from continuing operations
before income taxes and
minority interest 10,396
Total assets of continuing operations $ 21,890 $ 3,958 $ 26,324 $ 29,377 $ 81,549
Operating income information for fiscal years 2003 and 2002 has been reclassified to conform to current-year presentation.
Domestic long-lived assets, net, excluding goodwill were $43.7 billion and $39.3 billion in fiscal 2004 and 2003, respectively. Additions
to domestic long-lived assets were $6.5 billion, $6.1 billion and $4.7 billion in fiscal 2004, 2003 and 2002, respectively. International
long-lived assets, net, excluding goodwill were $17 billion and $14.7 billion in fiscal 2004 and 2003, respectively. Additions to
International long-lived assets were $3.3 billion, $2.3 billion and $1.4 billion in fiscal 2004, 2003 and 2002, respectively. The
International segment includes all international real estate. The operations of the Company’s ASDA subsidiary are significant in
comparison to the total operations of the International segment. ASDA sales during fiscal 2004, 2003 and 2002 were $21.7 billion,
$18.1 billion and $15.3 billion, respectively. At January 31, 2004 and 2003, ASDA long-lived assets, including primarily net plant,
property and equipment and net goodwill, totaled $16.3 billion and $14.2 billion, respectively.