Walmart 2004 Annual Report Download - page 23
Download and view the complete annual report
Please find page 23 of the 2004 Walmart annual report below. You can navigate through the pages in the report by either clicking on the pages listed below, or by using the keyword search tool below to find specific information within the annual report.-
 1
1 -
2
-
3
-
4
-
5
-
6
-
7
-
8
-
9
-
10
-
11
-
12
-
 13
13 -
 14
14 -
 15
15 -
 16
16 -
 17
17 -
 18
18 -
 19
19 -
 20
20 -
 21
21 -
 22
22 -
 23
23 -
 24
24 -
 25
25 -
 26
26 -
 27
27 -
 28
28 -
 29
29 -
 30
30 -
 31
31 -
 32
32 -
 33
33 -
34
-
35
-
36
-
37
-
38
-
39
-
40
-
41
-
42
-
43
-
44
-
45
-
46
-
47
-
48
-
49
-
50
-
51
-
52
-
53
-
54
-
55
-
56
-
57
-
58
-
59
-
60
 |
 |

Interest Costs
For fiscal 2004, interest costs on debt and capital leases, net of interest income, as a percentage of net sales decreased 0.1% when
compared to fiscal 2003. These decreases resulted primarily from lower average interest rates on our outstanding indebtedness and the
positive impact of our fixed- to variable-interest rate-swap program.
For fiscal 2003, interest costs on debt and capital leases, net of interest income, as a percentage of net sales decreased 0.2% when
compared to fiscal 2002. These decreases resulted from lower average interest rates on our outstanding indebtedness, less need for debt
financing due to our efforts to reduce our average inventory balances and the positive impact of our fixed- to variable-interest rate-
swap program. Our efforts to reduce average inventory balances included a focus on in-stock levels and reducing the amount of
inventories in the back-room and in storage trailers at the store locations.
Net Income
During fiscal 2004, we earned income from continuing operations of $8.9 billion, a 13.3% increase over fiscal 2003. Our income from
continuing operations for fiscal 2004 increased at a faster rate than net sales (11.6%) largely as a result of the increase in our gross
margin and a reduction in net interest expense. Partially offsetting gross margin and net interest expense improvements were increased
SG&A expenses in fiscal 2004 as discussed above, as well as a charge to earnings of $150 million that we took to increase our valuation
allowance related to deferred tax assets in Germany. As a result of new tax legislation in Germany in January 2004, we re-evaluated the
recoverability of our deferred tax asset in Germany. This increase in our valuation allowance also caused our effective tax rate to
increase from 35.2% in fiscal 2003 to 36.1% in fiscal 2004.
Our net income increased 13.8% over fiscal 2003 largely as a result of the 13.3% increase in income from continuing operations from
fiscal 2003 to 2004 described above, in addition to the $151 million after-tax gain on the sale of McLane.
During fiscal 2003, we earned income from continuing operations of $7.8 billion, a 21.2% increase over fiscal 2002. Our income from
continuing operations for fiscal 2003 increased at a rate faster than net sales (12.6%) largely as a result of the increase in our gross
margin and a reduction in net interest expense. Partially offsetting gross margin and net interest expense improvements were increased
SG&A expenses in fiscal 2003 as discussed above. Additionally, the comparison of net income earned in fiscal 2003 with the net income
earned in fiscal 2002 is favorably impacted by an accounting change related to goodwill amortization as required by Financial Accounting
Standards Board (“FASB”) Statement No. 142, “Goodwill and Other Intangible Assets” (“FAS 142”). Our fiscal 2002 net income would have
increased by $235 million and basic earnings per share would have increased by $0.06 if we had not amortized goodwill.
The change in accounting for goodwill had a positive impact on our effective income tax rate for fiscal 2003. Our effective tax rate for
fiscal 2003 was 35.2% compared with 36.2% for fiscal 2002. Had the accounting change been applied to fiscal 2002, the effective tax
rate would have been 35.5%.
As a result of the foregoing factors, our net income for fiscal 2003 increased by 20.7% over fiscal 2002.
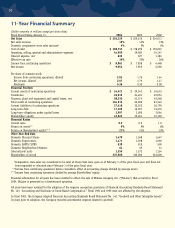
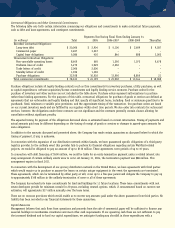
Wal-Mart Stores Segment
Segment Net Sales Increase Segment Operating Segment Operating Income Operating Income as a
Fiscal Year from Prior Fiscal Year Income (in millions) Increase from Prior Fiscal Year Percentage of Segment Sales
2004 10.9% $ 12,916 9.1% 7.4%
2003 12.9% 11,840 16.2% 7.5%
2002 14.1% 10,189 6.2% 7.3%
The segment net sales increases in fiscal 2004 and fiscal 2003 from the prior fiscal years resulted from comparative store sales increases
of 3.9% in fiscal 2004 and 5.7% in fiscal 2003, in addition to our expansion program in the Wal-Mart Stores segment. Comparative store
sales in 2004 increased at a slower rate than 2003 due to a softer economy and softer apparel sales. Our expansion programs consist of
opening new units, converting Discount Stores to Supercenters, relocations that result in more square footage, as well as enlargement of
existing stores. Segment expansion during fiscal 2004 included the opening of 41 Discount Stores, 15 Neighborhood Markets and 213
Supercenters (including the conversion and/or relocation of 130 existing Discount Stores into Supercenters). One store closed in fiscal
2004. During fiscal 2004, our total expansion program added approximately 34 million, or 8.8%, of store square footage. Segment
expansion during fiscal 2003 included the opening of 43 Discount Stores, 18 Neighborhood Markets and 192 Supercenters (including the
conversion and/or relocation of 122 existing Discount Stores into Supercenters). During fiscal 2003, our total expansion program added
approximately 32 million, or 9%, of store square footage in fiscal 2003.
The fiscal 2004 decrease in segment operating income as a percentage of segment sales compared with fiscal 2003 resulted from a 0.4%
increase in SG&A expense, which was partially offset by a 0.3% increase in gross margin for the segment compared with fiscal 2003. The
gross margin improvement was driven primarily by a favorable shift in mix of products sold and our global sourcing effort, despite
21