Walmart 2004 Annual Report Download - page 26
Download and view the complete annual report
Please find page 26 of the 2004 Walmart annual report below. You can navigate through the pages in the report by either clicking on the pages listed below, or by using the keyword search tool below to find specific information within the annual report.-
 1
1 -
2
-
3
-
4
-
5
-
6
-
7
-
8
-
9
-
10
-
11
-
12
-
13
-
14
-
15
-
 16
16 -
 17
17 -
 18
18 -
 19
19 -
 20
20 -
 21
21 -
 22
22 -
 23
23 -
 24
24 -
 25
25 -
 26
26 -
 27
27 -
 28
28 -
 29
29 -
 30
30 -
 31
31 -
 32
32 -
 33
33 -
 34
34 -
 35
35 -
 36
36 -
37
-
38
-
39
-
40
-
41
-
42
-
43
-
44
-
45
-
46
-
47
-
48
-
49
-
50
-
51
-
52
-
53
-
54
-
55
-
56
-
57
-
58
-
59
-
60
 |
 |

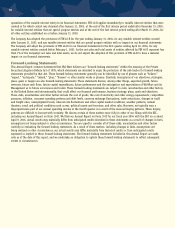
circumstances indicate that the carrying value may not be recoverable. Management’s judgments regarding the existence of impairment
indicators are based on market conditions and our operational performance, such as operating profit and cash flows. The variability of
these factors depends on a number of conditions, including uncertainty about future events, and thus our accounting estimates may
change from period to period. These factors could cause Management to conclude that impairment indicators exist and require that
impairment tests be performed, which could result in Management determining that the value of long-lived assets is impaired, resulting
in a write-down of the long-lived assets.
Goodwill is evaluated under the provisions of Financial Accounting Standards Board Statement No. 142, “Accounting for Goodwill and Other
Intangibles,” for impairment annually or whenever events or changes in circumstances indicate that the value of certain goodwill may be
impaired. The evaluation requires the Company to make judgments relating to future cash flows, growth rates, economic and market
conditions. These evaluations are based on discounted cash flows that incorporate the impact of existing Company businesses. Historically,
the Company has generated sufficient returns to recover the cost of goodwill and other intangible assets. Because of the nature of the
factors used in these tests, if different conditions occur in future periods, future operating results could be materially impacted.
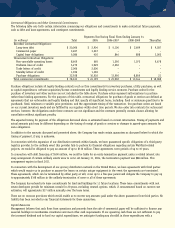
Self-Insurance
We use a combination of insurance, self-insured retention and/or self-insurance for a number of risks including workers’ compensation,
general liability, vehicle liability and the Company’s portion of employee-related health care benefits. Liabilities associated with the risks
that we retain are estimated in part by considering historical claims experience, including both frequency and severity, demographic
factors, and other assumptions. In calculating our liability, we analyze our historical trends, including loss development, and apply
appropriate loss-development factors to the incurred costs associated with the claims made against our self-insured program. The
estimated accruals for these liabilities could be significantly affected if future occurrences or loss development differ from these
assumptions or historical trends. For example, a 1% increase or decrease to the assumptions for claim costs, loss development factors
and healthcare costs would increase or decrease our self-insurance accrual by $17.5 million, $44.8 million and $12 million, respectively.
For a complete listing of our accounting policies, please see Note 1 to our consolidated financial statements that appear after
this discussion.
Liquidity and Capital Resources
Overview
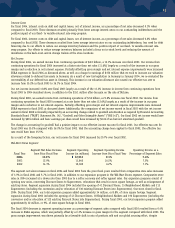
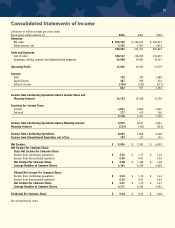
Cash flows provided by operating activities of continuing operations provide us with a significant source of liquidity. Our cash flows from
operating activities were $15.9 billion in fiscal 2004, up from $12.9 billion in fiscal 2003. Operating cash flows from continuing operations
increased during fiscal 2004 compared with fiscal 2003 primarily due to an increase in net income, improved inventory management,
accounts payable growing at a faster rate than inventories, and a decrease in accounts receivable of $373 million compared to an increase
in fiscal 2003 of $159 million due to the collection of foreign taxes receivable. Accrued liabilities increased by $1.8 billion compared with
an increase of $1.1 billion in fiscal 2003 due to increases in accruals for self-insurance, salaries, interest and taxes.
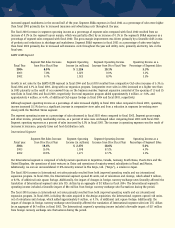
In fiscal 2004, we paid dividends of $1.6 billion, made $10.3 billion in capital expenditures, paid $5 billion to repurchase shares of our
stock on the open market, received $4.1 billion from the issuance of long-term debt and paid $3.5 billion of long-term debt. In
addition, we received $1.5 billion from the sale of McLane.
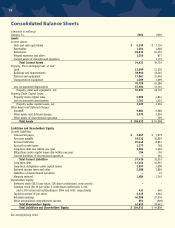
Working Capital
Current liabilities exceeded current assets at January 31, 2004, by $3 billion, an increase of $1.2 billion from the prior year. Our ratio of
current assets to current liabilities was 0.9 to 1 at January 31, 2004 and 2003. At January 31, 2004, we had total assets of $104.9
billion compared with total assets of $94.8 billion at January 31, 2003.
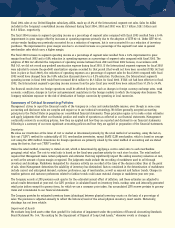
Company Stock Repurchase Program and Common Stock Dividends
In June 2003, our Board of Directors reset the common stock repurchase program authorization so that the Company may make future
repurchases of its stock of up to $5 billion. In January 2004, our Board of Directors authorized a new $7 billion share repurchase
program, separate from and replacing the $5 billion previously authorized. During fiscal 2004, we repurchased 91.9 million shares of our
common stock for approximately $5 billion. At January 31, 2004, we had approximately $6.6 billion remaining on our common stock
repurchase authorization. Shares purchased under our share repurchase program are constructively retired and returned to unissued
status. We consider several factors in determining when to make share repurchases, including among other things our cost of equity, our
after-tax cost of borrowing, our debt to total capitalization targets and our expected future cash needs. There is no expiration date or
other restriction governing the period over which we can make our share repurchases under the program.
We paid dividends totaling approximately $1.6 billion or $0.36 per share in fiscal 2004. In March 2004, our Board of Directors
authorized a 44% increase in our dividend to $0.52 per share for fiscal 2005. The Company has increased its dividend every year since it
first declared a dividend in March 1974.
24