Walmart 2004 Annual Report Download - page 21
Download and view the complete annual report
Please find page 21 of the 2004 Walmart annual report below. You can navigate through the pages in the report by either clicking on the pages listed below, or by using the keyword search tool below to find specific information within the annual report.-
 1
1 -
2
-
3
-
4
-
5
-
6
-
7
-
8
-
9
-
10
-
 11
11 -
 12
12 -
 13
13 -
 14
14 -
 15
15 -
 16
16 -
 17
17 -
 18
18 -
 19
19 -
 20
20 -
 21
21 -
 22
22 -
 23
23 -
 24
24 -
 25
25 -
 26
26 -
 27
27 -
 28
28 -
 29
29 -
 30
30 -
 31
31 -
32
-
33
-
34
-
35
-
36
-
37
-
38
-
39
-
40
-
41
-
42
-
43
-
44
-
45
-
46
-
47
-
48
-
49
-
50
-
51
-
52
-
53
-
54
-
55
-
56
-
57
-
58
-
59
-
60
 |
 |

• SAM’S CLUB’s renewed focus on our business members helped drive a 10.1% increase in operating profit on an 8.9% increase in
sales when comparing fiscal 2004 with fiscal 2003;
• When compared to fiscal 2003, our Wal-Mart Stores segment experienced a 9.1% increase in operating profit and a 10.9% increase
in sales in fiscal 2004;
• In May 2003, we sold our subsidiary McLane Company, Inc. (“McLane”) for $1.5 billion and recognized a $151 million after-tax gain
on the sale, or $0.03 per share. Management decided to sell McLane because it did not fit within the Company’s core retail
business. McLane’s external sales prior to the divestiture were $4.3 billion in fiscal 2004 and $14.9 billion for fiscal 2003. McLane
continues to be a supplier to the Company;
• We re-evaluated the recoverability of the deferred tax asset related to our German operations as the result of new tax legislation in
Germany. Based on the results of our review, we recorded a valuation allowance in the amount of $150 million, or $0.03 per share,
during the fourth quarter of fiscal 2004;
• On February 1, 2003, we adopted the expense provisions of Financial Accounting Standards Board Statement No. 123, “Stock-Based
Compensation,” and retroactively restated our financial statements. As a result of adopting this standard, we recorded $102 million
after-tax of stock compensation expense in 2004, or $0.02 per share; and
• On February 1, 2003, we adopted Emerging Issues Task Force Consensus No. 02-16, “Accounting by a Reseller for Cash Consideration
Received from a Vendor.” This change in accounting reduced fiscal 2004 net income by $140 million on an after-tax basis, or
$0.03 per share. As a result of adopting this standard, we account for substantially all consideration from vendors as a reduction of
inventory purchases.
Company Performance Measures
Management uses a number of metrics to assess its performance. The following are the more frequently discussed metrics:
• Comparative store sales is a measure which indicates whether our existing stores continue to gain market share. We consider
comparative store sales to be sales at stores that were open as of February 1st of the prior fiscal year and have not been expanded
or relocated during the current period. Stores that were expanded or relocated during that period are not included in the
calculation of comparative store sales. Comparative store sales are also referred to as “same-store” sales by others within the retail
industry. Our Wal-Mart Stores segment’s comparative store sales were 3.9% for fiscal 2004 versus 5.7% in fiscal 2003. The lower
comparative store sales growth in fiscal 2004 is largely reflective of the softer economy in fiscal 2004. Our SAM’S CLUB segment’s
comparative store sales were 5.3% in fiscal 2004 versus 2.3% in fiscal 2003. The more favorable growth in fiscal 2004 was the result
of our renewed focus on the business member;
• Operating profit growth greater than sales growth has long been a measure of success for us. For fiscal 2004 our operating profit
increased by 13.0% when compared to fiscal 2003, while sales increased by 11.6% over the same period. As previously noted, our
International and SAM’S CLUB segments met this target, while the Wal-Mart Stores segment fell slightly short. A tough economy,
weak apparel sales and increased apparel markdowns prevented our Wal-Mart Stores segment from reaching this goal;
• Inventory growth at a rate less than half of sales growth is a key measure of our efficiency. Total inventories at January 31, 2004,
were up 9.1% over levels at January 31, 2003, and sales were up 11.6% when comparing fiscal 2004 with fiscal 2003. This ratio was
affected by sales which were weaker than anticipated, as well as by increased imported merchandise in fiscal 2004, which has
longer lead time; and
• With an asset base as large as ours, we are focused on continuing to make certain our assets are productive. It is important for us
to sustain our return on assets at its current level. Return on assets is defined as income from continuing operations divided by
average total assets.
Operating Results
The discussion of our operating results below excludes the results of our discontinued operation, McLane, for all periods presented.
Net Sales
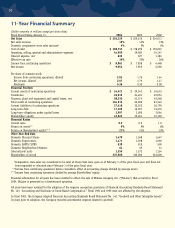
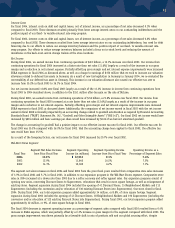
The Company and each of its operating segments had net sales (in millions) for the three fiscal years ended January 31, as follows:
Total Company Increase
Fiscal Year Wal-Mart Stores SAM’S CLUB International Total Company from Prior Fiscal Year
2004 $ 174,220 $ 34,537 $ 47,572 $ 256,329 12%
2003 157,120 31,702 40,794 229,616 13%
2002 139,131 29,395 35,485 204,011 13%
Our total net sales increased by 12% in fiscal 2004 when compared with fiscal 2003. That increase resulted from our domestic and
international expansion programs along with comparative store sales increases. Domestic expansion during fiscal 2004 resulted from the
19