Walmart 2004 Annual Report Download - page 49
Download and view the complete annual report
Please find page 49 of the 2004 Walmart annual report below. You can navigate through the pages in the report by either clicking on the pages listed below, or by using the keyword search tool below to find specific information within the annual report.-
 1
1 -
2
-
3
-
4
-
5
-
6
-
7
-
8
-
9
-
10
-
11
-
12
-
13
-
14
-
15
-
16
-
17
-
18
-
19
-
20
-
21
-
22
-
23
-
24
-
25
-
26
-
27
-
28
-
29
-
30
-
31
-
32
-
33
-
34
-
35
-
36
-
37
-
38
-
 39
39 -
 40
40 -
 41
41 -
 42
42 -
 43
43 -
 44
44 -
 45
45 -
 46
46 -
 47
47 -
 48
48 -
 49
49 -
 50
50 -
 51
51 -
 52
52 -
 53
53 -
 54
54 -
 55
55 -
 56
56 -
 57
57 -
 58
58 -
 59
59 -
60
 |
 |

47
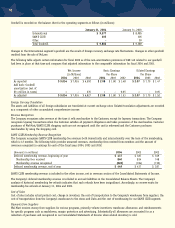
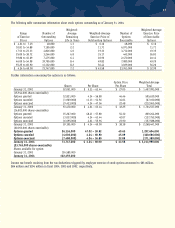
The following table summarizes information about stock options outstanding as of January 31, 2004:
Weighted- Weighted-Average
Range Number of Average Weighted-Average Number of Exercise Price
of Exercise Outstanding Remaining Exercise Price of Options of Exercisable
Prices Options Life in Years Outstanding Options Exercisable Options
$ 4.24 to 7.25 48,000 1.3 $ 6.16 48,000 $ 6.16
10.81 to 14.88 7,185,000 2.2 11.71 6,973,000 11.71
17.53 to 23.33 4,826,000 4.0 19.33 3,712,000 19.35
25.00 to 38.72 3,266,000 6.8 35.17 442,000 26.83
39.86 to 45.69 7,475,000 6.4 40.92 2,470,000 40.14
46.00 to 54.98 39,785,000 8.4 49.82 7,089,000 49.20
55.25 to 60.90 11,162,000 8.2 56.44 3,029,000 56.26
$ 4.24 to 60.90 73,747,000 7.2 $ 43.58 23,763,000 $ 32.99
Further information concerning the options is as follows:
Option Price Weighted-Average
Shares Per Share Per Share Total
January 31, 2001 52,051,000 $ 5.33 – 63.44 $ 27.05 $ 1,407,993,000
(15,944,000 shares exercisable)
Options granted 12,821,000 4.24 – 56.80 46.46 595,639,000
Options canceled (1,969,000) 11.13 – 54.56 34.04 (67,030,000)
Options exercised (9,433,000) 4.24 – 47.56 22.48 (212,065,000)
January 31, 2002 53,470,000 $ 4.24 – 63.44 $ 32.25 $ 1,724,537,000
(16,823,000 shares exercisable)
Options granted 15,267,000 48.41 – 57.80 54.32 829,244,000
Options canceled (3,037,000) 4.24 – 63.44 42.07 (127,752,000)
Options exercised (6,595,000) 4.24 – 55.94 23.90 (157,588,000)
January 31, 2003 59,105,000 $ 4.24 – 60.90 $ 38.38 $ 2,268,441,000
(20,053,000 shares exercisable)
Options granted 26,136,000 47.02 – 59.92 49.65 1,297,604,000
Options canceled (4,006,000) 4.24 – 60.90 45.09 (180,666,000)
Options exercised (7,488,000) 4.24 – 56.80 22.89 (171,389,000)
January 31, 2004 73,747,000 $ 4.24 – 60.90 $ 43.58 $ 3,213,990,000
(23,763,000 shares exercisable)
Shares available for option:
January 31, 2003 124,589,000
January 31, 2004 102,459,000
Income tax benefit resulting from the tax deductions triggered by employee exercise of stock options amounted to $83 million,
$84 million and $106 million in fiscal 2004, 2003 and 2002, respectively.