Walmart 2004 Annual Report Download - page 24
Download and view the complete annual report
Please find page 24 of the 2004 Walmart annual report below. You can navigate through the pages in the report by either clicking on the pages listed below, or by using the keyword search tool below to find specific information within the annual report.-
 1
1 -
2
-
3
-
4
-
5
-
6
-
7
-
8
-
9
-
10
-
11
-
12
-
13
-
 14
14 -
 15
15 -
 16
16 -
 17
17 -
 18
18 -
 19
19 -
 20
20 -
 21
21 -
 22
22 -
 23
23 -
 24
24 -
 25
25 -
 26
26 -
 27
27 -
 28
28 -
 29
29 -
 30
30 -
 31
31 -
 32
32 -
 33
33 -
 34
34 -
35
-
36
-
37
-
38
-
39
-
40
-
41
-
42
-
43
-
44
-
45
-
46
-
47
-
48
-
49
-
50
-
51
-
52
-
53
-
54
-
55
-
56
-
57
-
58
-
59
-
60
 |
 |

increased apparel markdowns in the second half of the year. Segment SG&A expenses in fiscal 2004 as a percentage of sales were higher
than fiscal 2003 primarily due to increased insurance and advertising costs throughout the year.
The fiscal 2003 increase in segment operating income as a percentage of segment sales compared with fiscal 2002 resulted from an
increase of 0.2% in the segment’s gross margin, which was partially offset by an increase of 0.1% in the segment’s SG&A expenses as a
percentage of segment sales compared with fiscal 2002. The gross margin improvement was driven primarily by a favorable shift in mix
of products and reductions in shrinkage and markdowns. Segment SG&A expenses in fiscal 2003 as a percentage of sales were higher
than fiscal 2002 primarily due to increased self-insurance costs throughout the year and utility costs, primarily electricity, late in the
fiscal year.
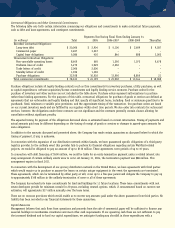
SAM’S CLUB Segment
Segment Net Sales Increase Segment Operating Segment Operating Income Operating Income as a
Fiscal Year from Prior Fiscal Year Income (in millions) Increase from Prior Fiscal Year Percentage of Segment Sales
2004 8.9% $ 1,126 10.1% 3.3%
2003 7.8% 1,023 0.0% 3.2%
2002 9.7% 1,023 8.9% 3.5%
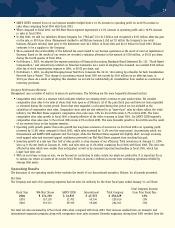
Growth in net sales for the SAM’S CLUB segment in fiscal 2004 and fiscal 2003 resulted from comparative Club sales increases of 5.3% in
fiscal 2004 and 2.3% in fiscal 2003, along with our expansion program. Comparative store sales in 2004 increased at a higher rate than
in 2003 primarily as the result of our renewed focus on the business member. Segment expansion consisted of the opening of 13 and 25
new Clubs in fiscal 2004 and fiscal 2003, respectively. Our total expansion program added approximately 2 million, or 3.6%, and
approximately 4 million, or 6.4%, of additional Club square footage in fiscal 2004 and fiscal 2003, respectively.
Although segment operating income as a percentage of sales increased slightly in fiscal 2004 when compared to fiscal 2003, operating
income increased 10.1% due to a significant increase in comparative store sales and from a reduction in expenses by working more
closely with the Wal-Mart Stores segment.
The segment operating income as a percentage of sales decreased in fiscal 2003 when compared to fiscal 2002. Segment gross margin
and other income, primarily membership income, as a percent of sales were unchanged when comparing fiscal 2003 with fiscal 2002.
Segment operating expenses as a percent of sales increased by 0.3% in fiscal 2003. The increase in operating expenses was the result of
increases in insurance, property taxes and food distribution costs.
International Segment
Segment Net Sales Increase Segment Operating Segment Operating Income Operating Income as a
Fiscal year from Prior Fiscal Year Income (in millions) Increase from Prior Fiscal Year Percentage of Segment Sales
2004 16.6% $ 2,370 18.6% 5.0%
2003 15.0% 1,998 57.2% 4.9%
2002 10.5% 1,271 37.7% 3.6%
Our International segment is comprised of wholly owned operations in Argentina, Canada, Germany, South Korea, Puerto Rico and the
United Kingdom, the operations of joint ventures in China and operations of majority-owned subsidiaries in Brazil and Mexico.
Additionally, we own an unconsolidated 37.8% minority interest in The Seiyu, Ltd. (“Seiyu”), a retailer in Japan.
The fiscal 2004 increase in International net sales primarily resulted from both improved operating results and our international
expansion program. In fiscal 2004, the International segment opened 83 units, net of relocations and closings, which added 9 million,
or 8.5%, of additional unit square footage. Additionally, the impact of changes in foreign currency exchange rates favorably affected the
translation of International segment sales into U.S. dollars by an aggregate of $2 billion in fiscal 2004. The International segment’s
operating income included a favorable impact of $81 million from foreign currency exchange rate fluctuations during the period.
The fiscal 2003 increase in International net sales primarily resulted from both improved operating results and our international
expansion program. In fiscal 2003, including the units acquired in the Amigo acquisition, the International segment opened 118 units,
net of relocations and closings, which added approximately 9 million, or 9.1%, of additional unit square footage. Additionally, the
impact of changes in foreign currency exchange rates favorably affected the translation of International segment sales into U.S. dollars
by an aggregate of $47 million in fiscal 2003. The International segment’s operating income included a favorable impact of $17 million
from foreign currency exchange rate fluctuations during the period.
22