Walmart 2013 Annual Report Download - page 16
Download and view the complete annual report
Please find page 16 of the 2013 Walmart annual report below. You can navigate through the pages in the report by either clicking on the pages listed below, or by using the keyword search tool below to find specific information within the annual report.-
 1
1 -
2
-
3
-
4
-
5
-
 6
6 -
 7
7 -
 8
8 -
 9
9 -
 10
10 -
 11
11 -
 12
12 -
 13
13 -
 14
14 -
 15
15 -
 16
16 -
 17
17 -
 18
18 -
 19
19 -
 20
20 -
 21
21 -
 22
22 -
 23
23 -
 24
24 -
 25
25 -
 26
26 -
27
-
28
-
29
-
30
-
31
-
32
-
33
-
34
-
35
-
36
-
37
-
38
-
39
-
40
-
41
-
42
-
43
-
44
-
45
-
46
-
47
-
48
-
49
-
50
-
51
-
52
-
53
-
54
-
55
-
56
-
57
-
58
-
59
-
60
-
61
-
62
-
63
-
64
 |
 |

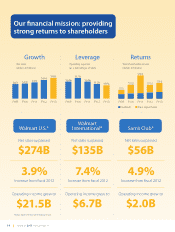
14 || Walmart 2013 Annual Report
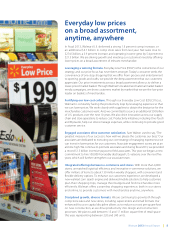
Net sales surpassed
$274B
Operating income grew to
$21.5B
3.9%
Increase from scal 2012
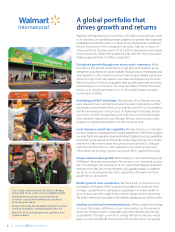
Net sales surpassed
$135B
Operating income grew to
$6.7B
7.4%
Increase from scal 2012
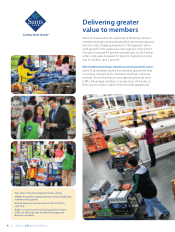
Net sales surpassed
$56B
Operating income grew to
$2.0B
4.9%
Increase from scal 2012
Growth
Our nancial mission: providing
strong returns to shareholders
ReturnsLeverage
Net sales
(dollars in billions)
Operating expense
(as a percentage of sales)
Total shareholder returns
(dollars in billions)
FY09 FY10 FY11 FY12 FY13
$466
$444
$419
$405
$401
FY09 FY10 FY11 FY12 FY13
19.1%
19.2%
19.4%
19.7%
19.4%
FY09
Dividends Share repurchases
FY10 FY11 FY12 FY13
$13.0
$11. 3
$19.2
$11. 5
$7.3
Walmart U.S.* Walmart
International* Sam’s Club*
*Dollars represent scal 2013 nancial results.