Walmart 2013 Annual Report Download - page 25
Download and view the complete annual report
Please find page 25 of the 2013 Walmart annual report below. You can navigate through the pages in the report by either clicking on the pages listed below, or by using the keyword search tool below to find specific information within the annual report.-
 1
1 -
2
-
3
-
4
-
5
-
6
-
7
-
8
-
9
-
10
-
11
-
12
-
13
-
14
-
 15
15 -
 16
16 -
 17
17 -
 18
18 -
 19
19 -
 20
20 -
 21
21 -
 22
22 -
 23
23 -
 24
24 -
 25
25 -
 26
26 -
 27
27 -
 28
28 -
 29
29 -
 30
30 -
 31
31 -
 32
32 -
 33
33 -
 34
34 -
 35
35 -
36
-
37
-
38
-
39
-
40
-
41
-
42
-
43
-
44
-
45
-
46
-
47
-
48
-
49
-
50
-
51
-
52
-
53
-
54
-
55
-
56
-
57
-
58
-
59
-
60
-
61
-
62
-
63
-
64
 |
 |

Management’s Discussion and Analysis of Financial
Condition and Results of Operations
Walmart 2013 Annual Report || 23
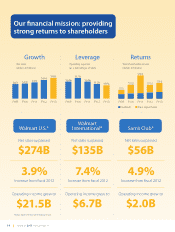
Our total revenues increased 5.0% and 6.0% for scal 2013 and 2012,
respectively, when compared to the previous scal year as a result of
increases in net sales, which increased 5.0% and 5.9% in scal 2013 and
2012, respectively, when compared to the previous scal year. The
increase in net sales for scal 2013 was due to 3.3% growth in retail
square feet and positive comparable store and club sales. Additionally,
net sales from acquisitions, through their respective anniversary dates,
accounted for $4.0 billion of the increase in net sales. The increase in
net sales was partially o set by $4.5 billion of negative impact from
uctuations in currency exchange rates. The increase in net sales for
scal 2012 was due to positive comparable store and club sales and
5.3% growth in retail square feet, which includes square feet added
through acquisitions. Net sales from acquisitions in scal 2012 accounted
for $4.7 billion of the increase in net sales and uctuations in currency
exchange rates positively impacted net sales by $4.0 billion.
Our gross pro t as a percentage of sales (“gross pro t rate”) declined
12 and 33 basis points in scal 2013 and 2012, respectively, when
compared to the previous scal year. The decline in gross pro t rate
during scal 2013 is primarily due to the Walmart U.S. segment’s strategic
focus on price investment and low price leadership. During scal 2012, all
three segments realized a decline in gross pro t rate due to investments
in price. Generally, our Walmart U.S. and Walmart International segments
realize higher gross pro t rates than our Sam’s Club segment, which
operates on lower margins as a membership club warehouse.
Operating expenses, as a percentage of net sales, were 19.1%, 19.2% and
19.4% for scal 2013, 2012 and 2011, respectively. In scal 2013 and 2012,
operating expenses, as a percentage of net sales, decreased primarily
due to our continued focus on expense management. We leveraged
operating expenses in scal 2013 and 2012. We are working to reduce
operating expenses as a percentage of sales by at least 100 basis points
over a ve-year period beginning with scal 2013 and achieved a
14 basis point reduction in scal 2013.
Operating income was $27.8 billion, $26.6 billion and $25.5 billion for
scal 2013, 2012 and 2011, respectively. Operating income increased in
scal 2013 and 2012, when compared to the previous scal year, primarily
for the reasons described above. Fluctuations in currency exchange rates
negatively impacted operating income $111 million in scal 2013 and
positively impacted operating income $105 million and $231 million in
scal 2012 and 2011, respectively.
Our e ective income tax rate was 31.0% for scal 2013 compared with
32.6% and 32.2% for scal 2012 and 2011, respectively. The scal 2013
e ective income tax rate was lower than the previous scal year primarily
due to a number of discrete tax items, including the positive impact from
scal 2013 legislative changes arising at the end of the scal year, most
notably the American Taxpayer Relief Act of 2012. The scal 2012 e ective
income tax rate was largely consistent with that for scal 2011. The
reconciliation from the U.S. statutory rate to the e ective income tax
rates for scal 2013, 2012 and 2011 is presented in Note 9 in the “Notes to
Consolidated Financial Statements.” Looking forward, we expect the
annual e ective income tax rate for scal year ended January 31, 2014
(“ scal 2014”) to range between 32.0% and 33.0%. As was the case with
our e ective income tax rate for scal 2013, our e ective income tax rate
may uctuate from period to period due to a variety of factors, including
changes in our assessment of certain tax contingencies, valuation
allowances, changes in tax laws, outcomes of administrative audits, the
impact of other discrete items and the mix of earnings among our U.S.
and international operations where the statutory rates are generally lower
than the U.S. statutory rate.
As a result of the factors discussed above, we reported $17.8 billion,
$16.5 billion and $16.0 billion of income from continuing operations for
scal 2013, 2012 and 2011, respectively. Diluted income per common
share from continuing operations attributable to Walmart (“EPS”) was
$5.02, $4.54 and $4.18 in scal 2013, 2012 and 2011, respectively. For scal
2014, we expect EPS to range between $5.20 and $5.40, which includes
incremental scal 2014 expenses of approximately $0.09 per share for
our e-commerce operations.
Walmart U.S. Segment
Fiscal Years Ended January 31,
(Amounts in millions, except unit counts) 2013 2012 2011
Net sales $274,490 $264,186 $260,261
Percentage change in net sales
from previous scal year 3.9% 1.5% 0.1%
Calendar comparable store sales 2.0% 0.3% (1.5)%
Operating income $ 21,500 $ 20,391 $ 19,941
Operating income as a
percentage of net sales 7.8% 7.7% 7.7%
Unit counts 4,005 3,868 3,804
Retail square feet 641 627 617