Walmart 2013 Annual Report Download - page 21
Download and view the complete annual report
Please find page 21 of the 2013 Walmart annual report below. You can navigate through the pages in the report by either clicking on the pages listed below, or by using the keyword search tool below to find specific information within the annual report.-
 1
1 -
2
-
3
-
4
-
5
-
6
-
7
-
8
-
9
-
10
-
 11
11 -
 12
12 -
 13
13 -
 14
14 -
 15
15 -
 16
16 -
 17
17 -
 18
18 -
 19
19 -
 20
20 -
 21
21 -
 22
22 -
 23
23 -
 24
24 -
 25
25 -
 26
26 -
 27
27 -
 28
28 -
 29
29 -
 30
30 -
 31
31 -
32
-
33
-
34
-
35
-
36
-
37
-
38
-
39
-
40
-
41
-
42
-
43
-
44
-
45
-
46
-
47
-
48
-
49
-
50
-
51
-
52
-
53
-
54
-
55
-
56
-
57
-
58
-
59
-
60
-
61
-
62
-
63
-
64
 |
 |

Walmart 2013 Annual Report || 19
Management’s Discussion and Analysis of Financial
Condition and Results of Operations
The Retail Industry
We operate in the highly competitive retail industry in all of the
countries we serve. We face strong sales competition from other discount,
department, drug, dollar, variety and specialty stores, warehouse clubs
and supermarkets. Many of these competitors are national, regional
or international chains, as well as internet-based retailers and catalog
businesses. We compete with a number of companies for prime retail
site locations, as well as in attracting and retaining quality employees
(whom we call “associates”). We, along with other retail companies, are
in uenced by a number of factors including, but not limited to: general
economic conditions, cost of goods, consumer disposable income,
consumer debt levels and buying patterns, consumer credit availability,
interest rates, tax rates, customer preferences, unemployment, labor
costs, in ation, de ation, currency exchange rate uctuations, fuel and
energy prices, weather patterns, climate change, catastrophic events,
competitive pressures and insurance costs. Further information on cer-
tain risks to our Company can be located in “Item 1A. Risk Factors” in our
Annual Report on Form 10-K for the scal year ended January 31, 2013,
and in the discussion under “Forward-Looking Statements.”
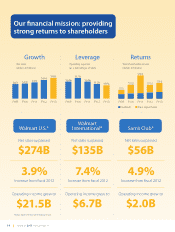
Company Performance Metrics
The Company’s performance metrics emphasize three priorities for
improving shareholder value: growth, leverage and returns. The Company’s
priority of growth focuses on sales through comparable store or club
sales and unit square feet growth; the priority of leverage encompasses
the Company’s objective to increase its operating income at a faster rate
than the growth in net sales by growing its operating, selling, general
and administrative expenses (“operating expenses”) at a slower rate than
the growth of its net sales; and the priority of returns focuses on how
e ciently the Company employs its assets through return on investment
and how e ectively the Company manages working capital and capital
expenditures through free cash ow.
Growth
Net Sales
Fiscal Years Ended January 31,
(Amounts in millions) 2013 2012 2011
Percent Percent Percent Percent Percent
Net Sales of Total Change Net Sales of Total Change Net Sales of Total
Walmart U.S. $274,490 58.9% 3.9% $264,186 59.5% 1.5% $260,261 62.1%
Walmart International 135,201 29.0% 7.4% 125,873 28.4% 15.2% 109,232 26.1%
Sam’s Club 56,423 12.1% 4.9% 53,795 12.1% 8.8% 49,459 11.8%
Net sales $466,114 100.0% 5.0% $443,854 100.0% 5.9% $418,952 100.0%
Calendar Comparable Store and Club Sales
Comparable store and club sales is a metric that indicates the performance of our existing U.S. stores and clubs by measuring the change in sales for
such stores and clubs for a particular period over the corresponding period in the previous year. The retail industry generally reports comparable store
and club sales using the retail calendar (also known as the 4-5-4 calendar) and, to be consistent with the retail industry, we provide comparable store
and club sales using the retail calendar in our quarterly earnings releases. However, when we discuss our comparable store and club sales below, we
are referring to our calendar comparable store and club sales calculated using our scal calendar. As our scal calendar di ers from the retail calendar,
our calendar comparable store and club sales also di er from the retail calendar comparable store and club sales provided in our quarterly earnings
releases. Calendar comparable store and club sales, as well as the impact of fuel, for scal 2013 and 2012, were as follows:
With Fuel Fuel Impact
Fiscal Years Ended January 31, Fiscal Years Ended January 31,
2013 2012 2013 2012
Walmart U.S. 2.0% 0.3% 0.0% 0.0%
Sam’s Club 4.1% 8.4% 0.3% 3.4%
Total U.S. 2.4% 1.6% 0.1% 0.6%
Our consolidated net sales increased 5.0% and 5.9% in scal 2013 and
2012, respectively, when compared to the previous scal year. The increase
in net sales for scal 2013 was due to 3.3% growth in retail square feet
and positive comparable store and club sales. Additionally, net sales from
acquisitions, through their respective anniversary dates, accounted for
$4.0 billion of the increase in net sales. The increase in net sales was
partially o set by $4.5 billion of negative impact from uctuations in
currency exchange rates. The increase in net sales for scal 2012 was
due to positive comparable store and club sales and 5.3% growth in retail
square feet, which includes square feet added through acquisitions.
Net sales from acquisitions in scal 2012 accounted for $4.7 billion of the
increase in net sales, and uctuations in currency exchange rates
positively impacted net sales by $4.0 billion.