Walmart 2013 Annual Report Download - page 24
Download and view the complete annual report
Please find page 24 of the 2013 Walmart annual report below. You can navigate through the pages in the report by either clicking on the pages listed below, or by using the keyword search tool below to find specific information within the annual report.-
 1
1 -
2
-
3
-
4
-
5
-
6
-
7
-
8
-
9
-
10
-
11
-
12
-
13
-
 14
14 -
 15
15 -
 16
16 -
 17
17 -
 18
18 -
 19
19 -
 20
20 -
 21
21 -
 22
22 -
 23
23 -
 24
24 -
 25
25 -
 26
26 -
 27
27 -
 28
28 -
 29
29 -
 30
30 -
 31
31 -
 32
32 -
 33
33 -
 34
34 -
35
-
36
-
37
-
38
-
39
-
40
-
41
-
42
-
43
-
44
-
45
-
46
-
47
-
48
-
49
-
50
-
51
-
52
-
53
-
54
-
55
-
56
-
57
-
58
-
59
-
60
-
61
-
62
-
63
-
64
 |
 |

Management’s Discussion and Analysis of Financial
Condition and Results of Operations
22 || Walmart 2013 Annual Report
Free Cash Flow
We de ne free cash ow as net cash provided by operating activities
in a period minus payments for property and equipment made in that
period. We generated free cash ow of $12.7 billion, $10.7 billion and
$10.9 billion for scal 2013, 2012 and 2011, respectively. The $2.0 billion
increase in free cash ow for scal 2013 compared to scal 2012 was
primarily due to higher income from continuing operations positively
impacting net cash generated from operating activities and lower
capital expenditures. The modest decline in free cash ow in scal 2012
compared to scal 2011 was primarily due to capital expenditures
outpacing the growth in net cash generated from operating activities.
Free cash ow is considered a non-GAAP nancial measure.
Management believes, however, that free cash ow, which measures
our ability to generate additional cash from our business operations, is
an important nancial measure for use in evaluating the Company’s
nancial performance. Free cash ow should be considered in addition
to, rather than as a substitute for, income from continuing operations
as a measure of our performance and net cash provided by operating
activities as a measure of our liquidity.
Additionally, our de nition of free cash ow is limited, in that it does not
represent residual cash ows available for discretionary expenditures
as the measure does not deduct the payments required for debt service
and other contractual obligations or payments made for business
acquisitions. Therefore, we believe it is important to view free cash ow
as a measure that provides supplemental information to our
Consolidated Statements of Cash Flows.
Although other companies report their free cash ow, numerous
methods may exist for calculating a company’s free cash ow. As a result,
the method used by our management to calculate our free cash ow
may di er from the methods other companies use to calculate their free
cash ow. We urge you to understand the methods used by other
companies to calculate their free cash ow before comparing our free
cash ow to that of such other companies.
The following table sets forth a reconciliation of free cash ow, a non-GAAP
nancial measure, to net cash provided by operating activities, which we
believe to be the GAAP nancial measure most directly comparable to
free cash ow, as well as information regarding net cash used in investing
activities and net cash used in nancing activities.
Fiscal Years Ended January 31,
(Amounts in millions) 2013 2012 2011
Net cash provided by
operating activities $ 25,591 $ 24,255 $ 23,643
Payments for property
and equipment (12,898) (13,510) (12,699)
Free cash ow $ 12,693 $ 10,745 $ 10,944
Net cash used in
investing activities
(1)
$(12,611) $(16,609) $(12,193)
Net cash used in
nancing activities $(11,972) $ (8,458) $(12,028)
(1) “Net cash used in investing activities” includes payments for property and
equipment, which is also included in our computation of free cash fl ow.
Results of Operations
The following discussion of our results of operations is based on
our continuing operations and excludes any results or discussion
of our discontinued operations.
Consolidated Results of Operations
(Amounts in millions, Fiscal Years Ended January 31,
except unit counts) 2013 2012 2011
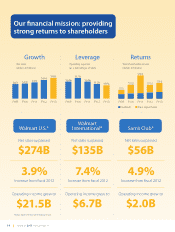
Total revenues $469,162 $446,950 $421,849
Percentage change in
total revenues from
previous scal year 5.0% 6.0% 3.4%
Net sales $466,114 $443,854 $418,952
Percentage change in
net sales from
previous scal year 5.0% 5.9% 3.4%
Total U.S. calendar comparable
store and club sales 2.4% 1.6% (0.6)%
Gross pro t margin as a
percentage of sales 24.4% 24.5% 24.8%
Operating income $ 27,801 $ 26,558 $ 25,542
Operating income as a
percentage of net sales 6.0% 6.0% 6.1%
Income from continuing
operations $ 17,756 $ 16,454 $ 15,959
Unit counts 10,773 10,130 8,970
Retail square feet 1,072 1,037 985