Walmart 2013 Annual Report Download - page 22
Download and view the complete annual report
Please find page 22 of the 2013 Walmart annual report below. You can navigate through the pages in the report by either clicking on the pages listed below, or by using the keyword search tool below to find specific information within the annual report.-
 1
1 -
2
-
3
-
4
-
5
-
6
-
7
-
8
-
9
-
10
-
11
-
 12
12 -
 13
13 -
 14
14 -
 15
15 -
 16
16 -
 17
17 -
 18
18 -
 19
19 -
 20
20 -
 21
21 -
 22
22 -
 23
23 -
 24
24 -
 25
25 -
 26
26 -
 27
27 -
 28
28 -
 29
29 -
 30
30 -
 31
31 -
 32
32 -
33
-
34
-
35
-
36
-
37
-
38
-
39
-
40
-
41
-
42
-
43
-
44
-
45
-
46
-
47
-
48
-
49
-
50
-
51
-
52
-
53
-
54
-
55
-
56
-
57
-
58
-
59
-
60
-
61
-
62
-
63
-
64
 |
 |

Management’s Discussion and Analysis of Financial
Condition and Results of Operations
20 || Walmart 2013 Annual Report
We believe comparing the growth of our operating expenses to the
growth of our net sales and comparing the growth of our operating
income to the growth of our net sales are meaningful measures as they
indicate how e ectively we manage costs and leverage operating
expenses. Our objective is to grow net sales at a faster rate than operating
expenses and to grow operating income at a faster rate than net sales.
On occasion, we may make strategic growth investments that may, at
times, cause our operating expenses to grow at a faster rate than net
sales and that may result in our operating income growing at a slower
rate than net sales.
Operating Expenses
We leveraged operating expenses in scal 2013 and 2012 due to our
continued focus on expense management. We are working to reduce
operating expenses as a percentage of sales by at least 100 basis points
over a ve-year period beginning with scal 2013 and achieved a
14 basis point reduction in scal 2013.
In scal 2013, our operating expenses and sales increased 4.2% and 5.0%,
respectively, when compared to scal 2012. In scal 2012, our operating
expenses and sales increased 4.8% and 5.9%, respectively, when
compared to scal 2011. Operating expenses increased in scal 2013
primarily due to overall Company growth, as net sales increased 5.0%.
Also contributing to the increase in operating expenses in scal 2013
were increased associate incentive payments, continued investment in
our Global eCommerce initiatives and incurred expenses related to third-
party advisors reviewing matters involving the Foreign Corrupt Practices
Act (“FCPA”). Acquisitions also increased operating expenses for scal
2013. In scal 2012, our Global eCommerce initiatives contributed to the
majority of the increase in operating expenses, as we continued to invest
in our e-commerce platforms. Depreciation expense also increased due
to our nancial system investments, with the remainder of the increase
being driven by multiple items, none of which were individually signi cant.
Operating Income
Operating income increased 4.7% and 4.0% in scal 2013 and 2012,
respectively, when compared to the previous scal year. Although we
leveraged operating expenses in scal 2013 and 2012, operating income
for both years grew at a slower rate than sales. In scal 2013, the primary
causes for operating income growing slower than sales were the
investments in our Global eCommerce initiatives and incurred expenses
related to third-party advisors reviewing matters involving the FCPA.
Additionally, our investment in price for products sold in our retail
operations, which reduces gross margin, contributed to operating
income growing slower than sales in scal 2013 and was the primary
cause for operating income growing slower than sales in scal 2012.
Returns
Return on Investment
Management believes return on investment (“ROI”) is a meaningful
metric to share with investors because it helps investors assess how
e ectively Walmart is deploying its assets. Trends in ROI can uctuate
over time as management balances long-term potential strategic
initiatives with possible short-term impacts. ROI was 18.2% and 18.6%
for scal 2013 and 2012, respectively. The decline in ROI was primarily due
to the impact of acquisitions and currency exchange rate uctuations.
We de ne ROI as adjusted operating income (operating income plus
interest income, depreciation and amortization, and rent expense) for
the scal year divided by average invested capital during that period.
We consider average invested capital to be the average of our beginning
and ending total assets of continuing operations, plus average
accumulated depreciation and average amortization less average
accounts payable and average accrued liabilities for that period, plus a
rent factor equal to the rent for the scal year or trailing twelve months
multiplied by a factor of eight.
Comparable store and club sales in the U.S., including fuel, increased 2.4% and 1.6% in scal 2013 and 2012, respectively, when compared to the
previous scal year. U.S. comparable store and club sales increased during scal 2013 as a result of improved average ticket and an increase in
customer tra c. U.S. comparable store sales increased during scal 2012 primarily due to an increase in average ticket, partially o set by a decline in
tra c, while comparable club sales were higher due to a larger member base driving increased tra c, as well as a broader assortment of items.
As we continue to add new stores and clubs in the U.S., we do so with an understanding that additional stores and clubs may take sales away from
existing units. We estimate the negative impact on comparable store and club sales as a result of opening new stores and clubs was approximately
0.7% in scal 2013 and 0.8% in scal 2012.
Leverage
Operating Income
Fiscal Years Ended January 31,
(Amounts in millions) 2013 2012 2011
Operating Percent Percent Operating Percent Percent Operating Percent
Income of Total Change Income of Total Change Income of Total
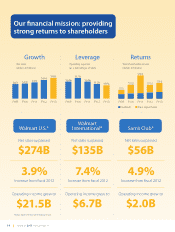
Walmart U.S. $21,500 77.3% 5.4% $20,391 76.7% 2.3% $19,941 78.1%
Walmart International 6,694 24.1% 8.3% 6,182 23.3% 10.9% 5,575 21.8%
Sam’s Club 1,963 7.1% 6.2% 1,848 7.0% 9.0% 1,695 6.6%
Other unallocated (2,356) (8.5)% 26.5% (1,863) (7.0)% 11.6% (1,669) (6.5)%
Total operating income $27,801 100.0% 4.7% $26,558 100.0% 4.0% $25,542 100.0%