Walmart 2013 Annual Report Download - page 26
Download and view the complete annual report
Please find page 26 of the 2013 Walmart annual report below. You can navigate through the pages in the report by either clicking on the pages listed below, or by using the keyword search tool below to find specific information within the annual report.-
 1
1 -
2
-
3
-
4
-
5
-
6
-
7
-
8
-
9
-
10
-
11
-
12
-
13
-
14
-
15
-
 16
16 -
 17
17 -
 18
18 -
 19
19 -
 20
20 -
 21
21 -
 22
22 -
 23
23 -
 24
24 -
 25
25 -
 26
26 -
 27
27 -
 28
28 -
 29
29 -
 30
30 -
 31
31 -
 32
32 -
 33
33 -
 34
34 -
 35
35 -
 36
36 -
37
-
38
-
39
-
40
-
41
-
42
-
43
-
44
-
45
-
46
-
47
-
48
-
49
-
50
-
51
-
52
-
53
-
54
-
55
-
56
-
57
-
58
-
59
-
60
-
61
-
62
-
63
-
64
 |
 |

Management’s Discussion and Analysis of Financial
Condition and Results of Operations
24 || Walmart 2013 Annual Report
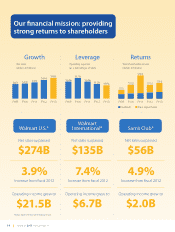
Net sales for the Walmart U.S. segment increased 3.9% and 1.5% for scal
2013 and 2012, respectively, when compared to the previous scal year.
The increase in net sales for scal 2013 compared to scal 2012 was due
to a 2.0% increase in comparable store sales as a result of higher average
ticket and an increase in customer tra c, combined with a 2.2% increase
in retail square feet. The increase in net sales for scal 2012 compared to
scal 2011 was primarily due to an increase of 1.6% in retail square feet.
Gross pro t rate declined 16 basis points for scal 2013, when compared
to the previous scal year, primarily due to our strategic focus on price
investment and low price leadership. Gross pro t rate was relatively at
in scal 2012 when compared to the previous scal year.
Operating expenses, as a percentage of segment net sales, declined
27 and 10 basis points during scal 2013 and 2012, respectively, when
compared to the previous scal year, primarily due to our continued
focus on productivity and expense management. As a result, Walmart
U.S. leveraged operating expenses in scal 2013 and 2012.
As a result of the factors discussed above, operating income was
$21.5 billion, $20.4 billion and $19.9 billion during scal 2013, 2012 and
2011, respectively. Walmart U.S. grew operating income faster than
sales during scal 2013 and 2012.
Walmart International Segment
(Amounts in millions, Fiscal Years Ended January 31,
except unit counts) 2013 2012 2011
Net sales $135,201 $125,873 $109,232
Percentage change from
previous scal year 7.4% 15.2% 12.1%
Operating income $ 6,694 $ 6,182 $ 5,575
Operating income as
a percentage of net sales 5.0% 4.9% 5.1%
Unit counts 6,148 5,651 4,557
Retail square feet 348 329 287
Net sales for the Walmart International segment increased 7.4% and
15.2% for scal 2013 and 2012, respectively, when compared to the previ-
ous scal year. The increase in net sales for scal 2013 was due to growth
in retail square feet of 5.9% and positive comparable sales. In addition,
net sales from acquisitions, through their respective anniversary dates,
accounted for $4.0 billion of the increase in net sales. The increase in net
sales was partially o set by $4.5 billion of negative impact from uctua-
tions in currency exchange rates. The increase in net sales for scal 2012
was due to 14.7% growth in retail square feet, which includes square feet
added through acquisitions. In scal 2012, acquisitions contributed
$4.7 billion in sales and a positive impact of $4.0 billion from uctuations
in currency exchange rates.
Gross pro t rate was at in scal 2013, when compared to scal 2012.
Gross pro t rate decreased 46 basis points for scal 2012, when
compared to scal 2011, due primarily to acquisitions included in
the scal 2012 results and not in the scal 2011 results.
Operating expenses, as a percentage of segment net sales, decreased
22 and 19 basis points in scal 2013 and 2012, respectively, when
compared to the previous scal year. Walmart International leveraged
operating expenses in scal 2013 and 2012, primarily due to our global
focus on expense management. While each country is focused on
leveraging operating expenses, the countries that generated the most
leverage included Brazil, Chile and the United Kingdom in scal 2013
and the United Kingdom, Japan and Canada in scal 2012.
As a result of the factors discussed above, operating income was
$6.7 billion, $6.2 billion and $5.6 billion for scal 2013, 2012 and 2011,
respectively. Fluctuations in currency exchange rates negatively
impacted operating income $111 million in scal 2013 and positively
impacted operating income $105 million and $231 million in scal 2012
and 2011, respectively. Walmart International grew operating income
faster than sales in scal 2013, but did not grow operating income faster
than sales in scal 2012.
Sam’s Club Segment
We believe the information in the following table under the caption
“Excluding Fuel” is useful to investors because it permits investors to
understand the e ect that fuel sales, which are impacted by the volatility
of fuel prices, has on the operating results of the Sam’s Club segment.
Volatility in fuel prices may continue to impact the operating results of
the Sam’s Club segment in the future.
Fiscal Years Ended January 31,
(Amounts in millions, except unit counts) 2013 2012 2011
Including fuel
Net sales $56,423 $53,795 $49,459
Percentage change from
previous scal year 4.9% 8.8% 3.5%
Calendar comparable club sales 4.1% 8.4% 3.9%
Operating income $ 1,963 $ 1,848 $ 1,695
Operating income as
a percentage of net sales 3.5% 3.4% 3.4%
Unit counts 620 611 609
Retail square feet 83 82 81
Excluding fuel
Net sales $49,789 $47,616 $45,193
Percentage change from
previous scal year 4.6% 5.4% 1.4%
Calendar comparable club sales 3.8% 5.0% 1.9%
Operating income $ 1,916 $ 1,809 $ 1,675
Operating income as
a percentage of net sales 3.8% 3.8% 3.7%