Windstream 2007 Annual Report Download - page 92
Download and view the complete annual report
Please find page 92 of the 2007 Windstream annual report below. You can navigate through the pages in the report by either clicking on the pages listed below, or by using the keyword search tool below to find specific information within the annual report.-
 1
1 -
2
-
3
-
4
-
5
-
6
-
7
-
8
-
9
-
10
-
11
-
12
-
13
-
14
-
15
-
16
-
17
-
18
-
19
-
20
-
21
-
22
-
23
-
24
-
25
-
26
-
27
-
28
-
29
-
30
-
31
-
32
-
33
-
34
-
35
-
36
-
37
-
38
-
39
-
40
-
41
-
42
-
43
-
44
-
45
-
46
-
47
-
48
-
49
-
50
-
51
-
52
-
53
-
54
-
55
-
56
-
57
-
58
-
59
-
60
-
61
-
62
-
63
-
64
-
65
-
66
-
67
-
68
-
69
-
70
-
71
-
72
-
73
-
74
-
75
-
76
-
77
-
78
-
79
-
80
-
81
-
 82
82 -
 83
83 -
 84
84 -
 85
85 -
 86
86 -
 87
87 -
 88
88 -
 89
89 -
 90
90 -
 91
91 -
 92
92 -
 93
93 -
 94
94 -
 95
95 -
 96
96 -
 97
97 -
 98
98 -
 99
99 -
 100
100 -
 101
101 -
 102
102 -
103
-
104
-
105
-
106
-
107
-
108
-
109
-
110
-
111
-
112
-
113
-
114
-
115
-
116
-
117
-
118
-
119
-
120
-
121
-
122
-
123
-
124
-
125
-
126
-
127
-
128
-
129
-
130
-
131
-
132
-
133
-
134
-
135
-
136
-
137
-
138
-
139
-
140
-
141
-
142
-
143
-
144
-
145
-
146
-
147
-
148
-
149
-
150
-
151
-
152
-
153
-
154
-
155
-
156
-
157
-
158
-
159
-
160
-
161
-
162
-
163
-
164
-
165
-
166
-
167
-
168
-
169
-
170
-
171
-
172
 |
 |

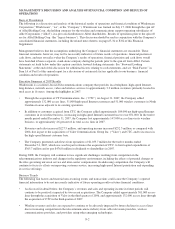
Consolidated revenues and sales increased $227.5 million, or 8 percent in 2007, and $109.8 million, or 4 percent, in
2006. Increases in consolidated revenues and sales are primarily due to the acquisitions of Valor and CTC, as well as to
increases in high-speed Internet customers, partially offset by declines in revenues associated with continued access
line losses.
Eliminations of affiliated revenues and sales and, related costs and expenses, increased primarily due to the
discontinued application of Statement of Financial Accounting Standards (“SFAS”) No. 71, “Accounting for the
Effects of Certain Types of Regulation” during the third quarter of 2006 (See Note 2). Previously, certain affiliated
revenues earned and expenses incurred by the Company’s regulated subsidiaries were not eliminated because they were
priced in accordance with Federal Communications Commission guidelines and were recovered through the regulatory
process.
See below a detailed discussion and analysis of segment revenues and sales in our discussion of segment operating
results.
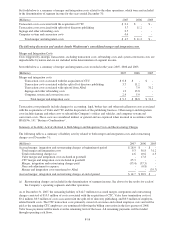
The following discussion and analysis details results for each of Windstream’s operating segments and other
operations.
Wireline Operations
(Millions, access lines and customers in thousands) 2007 (a,b) 2006 (a) 2005
Revenues and sales:
Voice service $ 1,256.7 $ 1,206.9 $ 1,171.4
Long distance 259.8 209.5 174.1
Data and special access 695.1 570.7 488.7
Switched access and USF 608.1 518.7 491.8
Miscellaneous 176.3 145.9 125.3
Directory publishing rights 56.4 61.9 58.1
Product sales 60.1 45.0 42.4
Total revenues and sales 3,112.5 2,758.6 2,551.8
Costs and expenses:
Cost of services 1,033.9 893.3 825.0
Cost of products sold 54.5 36.7 31.7
Selling, general, administrative and other 360.2 322.2 302.4
Depreciation and amortization 505.2 446.0 470.2
Royalty expense to Alltel - 129.6 268.8
Restructuring charges 4.5 10.5 4.5
Total costs and expenses 1,958.3 1,838.3 1,902.6
Segment income $ 1,154.2 $ 920.3 $ 649.2
Access lines in service (excludes high-speed Internet lines) (c)
Residential 2,118.1 2,156.3 1,918.0
Business 940.4 911.5 796.8
Wholesale (d) 30.8 40.5 28.4
Special circuits 113.9 111.0 105.7
Total access lines in service 3,203.2 3,219.3 2,848.9
Average access lines in service 3,188.4 3,022.9 2,901.2
Average revenue per customer per month (e) $81.35 $76.05 $73.30
High-speed Internet customers 871.4 656.1 397.7
Digital satellite television customers 195.6 87.7 9.3
Long distance customers (c) 2,066.6 1,957.1 1,716.8
(a) Results from wireline operations in 2007 and 2006 include results from the former Valor operations following
their acquisition on July 17, 2006. In the discussion and analysis provided below regarding changes in wireline
revenues and expenses in 2007 and 2006, the impact of the acquisition of Valor on these changes is considered to
be the portion of Valor revenues and expenses recognized during the period of each year for which results from
the Valor operations are not included in the comparative period of the prior year (January 1, 2007 – July 17, 2007
for 2007 and July 17, 2006 – December 31, 2006 for 2006, respectively). Changes in results in the former Valor
operations for periods for which results were also included in the comparative period of the prior year are
F-6