Windstream 2007 Annual Report Download - page 97
Download and view the complete annual report
Please find page 97 of the 2007 Windstream annual report below. You can navigate through the pages in the report by either clicking on the pages listed below, or by using the keyword search tool below to find specific information within the annual report.-
 1
1 -
2
-
3
-
4
-
5
-
6
-
7
-
8
-
9
-
10
-
11
-
12
-
13
-
14
-
15
-
16
-
17
-
18
-
19
-
20
-
21
-
22
-
23
-
24
-
25
-
26
-
27
-
28
-
29
-
30
-
31
-
32
-
33
-
34
-
35
-
36
-
37
-
38
-
39
-
40
-
41
-
42
-
43
-
44
-
45
-
46
-
47
-
48
-
49
-
50
-
51
-
52
-
53
-
54
-
55
-
56
-
57
-
58
-
59
-
60
-
61
-
62
-
63
-
64
-
65
-
66
-
67
-
68
-
69
-
70
-
71
-
72
-
73
-
74
-
75
-
76
-
77
-
78
-
79
-
80
-
81
-
82
-
83
-
84
-
85
-
86
-
 87
87 -
 88
88 -
 89
89 -
 90
90 -
 91
91 -
 92
92 -
 93
93 -
 94
94 -
 95
95 -
 96
96 -
 97
97 -
 98
98 -
 99
99 -
 100
100 -
 101
101 -
 102
102 -
 103
103 -
 104
104 -
 105
105 -
 106
106 -
 107
107 -
108
-
109
-
110
-
111
-
112
-
113
-
114
-
115
-
116
-
117
-
118
-
119
-
120
-
121
-
122
-
123
-
124
-
125
-
126
-
127
-
128
-
129
-
130
-
131
-
132
-
133
-
134
-
135
-
136
-
137
-
138
-
139
-
140
-
141
-
142
-
143
-
144
-
145
-
146
-
147
-
148
-
149
-
150
-
151
-
152
-
153
-
154
-
155
-
156
-
157
-
158
-
159
-
160
-
161
-
162
-
163
-
164
-
165
-
166
-
167
-
168
-
169
-
170
-
171
-
172
 |
 |

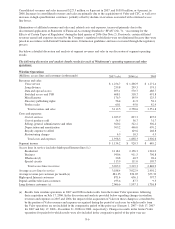
2006. The acquisition of Valor accounted for $2.2 million and $2.4 million of the year-over-year increases in product
sales in 2007 and 2006, respectively. Of the increase in 2007, $9.6 million was due to the increase in customer premise
equipment sales to business customers, with the remaining increases due primarily to high-speed Internet modem sales.
During the fourth quarter of 2006, Windstream began selling high-speed Internet modems to customers subject to a
rebate offer. The rebate offer is for a fixed amount per modem and expires after 45 days if not claimed by the customer.
Modem sales recognized in the twelve month period ended December 31, 2007 pursuant to the rebate program have
been reduced by the portion of rebates expected to be claimed by customers.
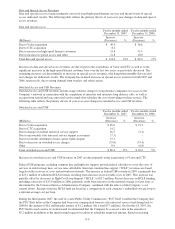
Average Revenue per Customer
Average revenue per customer per month increased 7 percent and 4 percent in 2007 and 2006, respectively, primarily
due to high-speed Internet customer growth and pricing increases on long distance services as discussed above. Future
growth in average revenue per customer per month will depend on the Company’s success in sustaining growth in sales
of high-speed Internet and other enhanced services to new and existing customers.
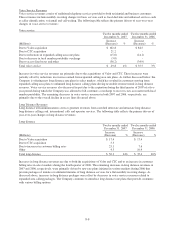
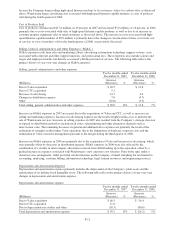
Cost of Services
Cost of services primarily consist of network operations costs, including salaries and wages, employee benefits,
materials, contract services and information technology costs to support the network. Cost of services also include
interconnection expense, bad debt expense and business taxes. The following table reflects the primary drivers of year-
over-year changes in cost of services:
Cost of services
Twelve months ended
December 31, 2007
Twelve months ended
December 31, 2006
(Millions)
Increase
(Decrease) %
Increase
(Decrease) %
Due to Valor acquisition $ 75.7 $ 67.5
Due to CTC acquisition 18.6 -
Due to increases in interconnection expenses 12.2 21.1
Due to changes in network operations expense 31.8 (4.2)
Due to decreases in customer service expense (7.7) (3.3)
Due to changes in bad debt expense 11.3 (11.3)
Due to increases in business taxes and USF fees 8.9 1.4
Due to decreases in high-speed Internet modem costs (9.9) (3.8)
Other (0.3) 0.9
Total cost of services $ 140.6 16% $ 68.3 8%
Increases in cost of services are due in part to the acquisitions of Valor and CTC. Increases in interconnection expenses
are due primarily to increases in the volume of long distance traffic resulting from the increases in customers on
packaged minute and unlimited usage rate plans as discussed above. Interconnection expenses also increased due to
increases in Internet usage associated with increases in high-speed Internet customers and higher usage by our
customers. Partially offsetting these increases in interconnection expense are the favorable impacts of negotiated rate
reductions and settlements with other carriers for disputed network access and termination charges. The increase in
network operations expense in 2007 is due to increased costs necessary to support desired service levels and to
facilitate the increase in high-speed Internet customers as discussed above. Decreases in customer service expense in
2006 were due to the realignment of the customer service operation and the realization of operational efficiencies (See
Note 10).
Increases in bad debt expense in 2007 are primarily due to increases in non-pay disconnects and other account write-
offs. In 2006, bad debt expense decreased, consistent with the decline in retail revenues and access lines in the
Company’s legacy operations and due to improvements in collection rates. Additionally, in December 2006,
Windstream sold certain customer receivables that had been deemed uncollectible to a third party collection agency for
$3.8 million, which was reflected as a reduction in bad debt expense. Increases in business taxes and USF fees were
due primarily to increases in the contribution factors used to determine the Company’s USF obligations, as well as due
to increases in USF assessments related to the increases in long distance revenues. Additionally, business taxes
increased due to a contingency reserve established in the fourth quarter for the potential settlement of a tax assessment
currently in dispute.
Cost of services also declined in 2006 due to decreases in costs associated with providing high-speed Internet-capable
modems to new high-speed Internet customers driven by volume discounts earned by the Company. In addition,
F-11