Windstream 2007 Annual Report Download - page 94
Download and view the complete annual report
Please find page 94 of the 2007 Windstream annual report below. You can navigate through the pages in the report by either clicking on the pages listed below, or by using the keyword search tool below to find specific information within the annual report.-
 1
1 -
2
-
3
-
4
-
5
-
6
-
7
-
8
-
9
-
10
-
11
-
12
-
13
-
14
-
15
-
16
-
17
-
18
-
19
-
20
-
21
-
22
-
23
-
24
-
25
-
26
-
27
-
28
-
29
-
30
-
31
-
32
-
33
-
34
-
35
-
36
-
37
-
38
-
39
-
40
-
41
-
42
-
43
-
44
-
45
-
46
-
47
-
48
-
49
-
50
-
51
-
52
-
53
-
54
-
55
-
56
-
57
-
58
-
59
-
60
-
61
-
62
-
63
-
64
-
65
-
66
-
67
-
68
-
69
-
70
-
71
-
72
-
73
-
74
-
75
-
76
-
77
-
78
-
79
-
80
-
81
-
82
-
83
-
 84
84 -
 85
85 -
 86
86 -
 87
87 -
 88
88 -
 89
89 -
 90
90 -
 91
91 -
 92
92 -
 93
93 -
 94
94 -
 95
95 -
 96
96 -
 97
97 -
 98
98 -
 99
99 -
 100
100 -
 101
101 -
 102
102 -
 103
103 -
 104
104 -
105
-
106
-
107
-
108
-
109
-
110
-
111
-
112
-
113
-
114
-
115
-
116
-
117
-
118
-
119
-
120
-
121
-
122
-
123
-
124
-
125
-
126
-
127
-
128
-
129
-
130
-
131
-
132
-
133
-
134
-
135
-
136
-
137
-
138
-
139
-
140
-
141
-
142
-
143
-
144
-
145
-
146
-
147
-
148
-
149
-
150
-
151
-
152
-
153
-
154
-
155
-
156
-
157
-
158
-
159
-
160
-
161
-
162
-
163
-
164
-
165
-
166
-
167
-
168
-
169
-
170
-
171
-
172
 |
 |

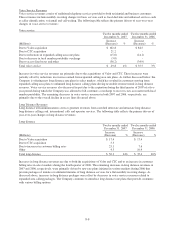
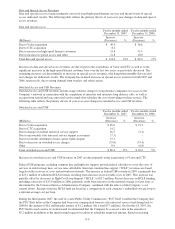
Voice Service Revenues
Voice service revenues consist of traditional telephone services provided to both residential and business customers.
These revenues include monthly recurring charges for basic services such as local dial-tone and enhanced services such
as caller identification, voicemail and call waiting. The following table reflects the primary drivers of year-over-year
changes in voice service revenues:
Voice service
Twelve months ended
December 31, 2007
Twelve months ended
December 31, 2006
(Millions)
Increase
(Decrease) %
Increase
(Decrease) %
Due to Valor acquisition $ 102.8 $ 84.5
Due to CTC acquisition 21.2 -
Due to reductions in expanded calling area rate plans (15.0) (14.1)
Due to decrease in local number portability surcharge (3.0) -
Due to access line losses and other (56.2) (34.9)
Total voice service $ 49.8 4% $ 35.5 3%
Increases in voice service revenues are primarily due to the acquisitions of Valor and CTC. These increases were
partially offset by reductions in revenues earned from expanded calling area rate plans. As further discussed below, the
Company is offering new long distance rate plans in select markets, which has resulted in customers moving from
expanded calling area plans to unlimited long distance calling plans driving favorable revenue trends in long distance
revenues. Voice service revenues also decreased in part due to the expiration during the third quarter of 2007 of a five-
year period during which the Company was allowed to bill customers a surcharge to recover costs associated with local
number portability. The remaining decreases in voice service revenues in both 2007 and 2006, respectively, are
primarily due to the overall decline in access lines discussed above.
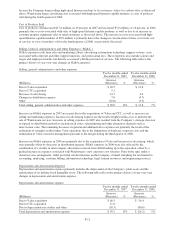
Long Distance Revenues
Long distance telecommunications services generate revenues from switched interstate and intrastate long distance,
long distance calling card, international calls and operator services. The following table reflects the primary drivers of
year-over-year changes in long distance revenues:
Long distance
Twelve months ended
December 31, 2007
Twelve months ended
December 31, 2006
(Millions)
Increase
(Decrease) %
Increase
(Decrease) %
Due to Valor acquisition $ 17.4 $ 17.4
Due to CTC acquisition 3.5 -
Due to increases in customer billing rates 25.1 7.6
Other 4.3 10.4
Total long distance $ 50.3 24% $ 35.4 20%
Increases in long distance revenues are due to both the acquisitions of Valor and CTC and to an increase in customer
billing rates in select markets during the fourth quarter of 2006. The remaining increases in long distance revenues in
2007 and 2006, respectively, were primarily driven by new rate plans initiated in various markets during 2006 that
provide packages of minutes or unlimited minutes of long distance services for a flat monthly recurring charge. As
discussed above, increases in long distance packages were offset by decreases in voice service revenues related to
expanded area calling packages. The Company continues to introduce long distance rate plans that provide customers
with various billing options.
F-8