Windstream 2007 Annual Report Download - page 95
Download and view the complete annual report
Please find page 95 of the 2007 Windstream annual report below. You can navigate through the pages in the report by either clicking on the pages listed below, or by using the keyword search tool below to find specific information within the annual report.-
 1
1 -
2
-
3
-
4
-
5
-
6
-
7
-
8
-
9
-
10
-
11
-
12
-
13
-
14
-
15
-
16
-
17
-
18
-
19
-
20
-
21
-
22
-
23
-
24
-
25
-
26
-
27
-
28
-
29
-
30
-
31
-
32
-
33
-
34
-
35
-
36
-
37
-
38
-
39
-
40
-
41
-
42
-
43
-
44
-
45
-
46
-
47
-
48
-
49
-
50
-
51
-
52
-
53
-
54
-
55
-
56
-
57
-
58
-
59
-
60
-
61
-
62
-
63
-
64
-
65
-
66
-
67
-
68
-
69
-
70
-
71
-
72
-
73
-
74
-
75
-
76
-
77
-
78
-
79
-
80
-
81
-
82
-
83
-
84
-
 85
85 -
 86
86 -
 87
87 -
 88
88 -
 89
89 -
 90
90 -
 91
91 -
 92
92 -
 93
93 -
 94
94 -
 95
95 -
 96
96 -
 97
97 -
 98
98 -
 99
99 -
 100
100 -
 101
101 -
 102
102 -
 103
103 -
 104
104 -
 105
105 -
106
-
107
-
108
-
109
-
110
-
111
-
112
-
113
-
114
-
115
-
116
-
117
-
118
-
119
-
120
-
121
-
122
-
123
-
124
-
125
-
126
-
127
-
128
-
129
-
130
-
131
-
132
-
133
-
134
-
135
-
136
-
137
-
138
-
139
-
140
-
141
-
142
-
143
-
144
-
145
-
146
-
147
-
148
-
149
-
150
-
151
-
152
-
153
-
154
-
155
-
156
-
157
-
158
-
159
-
160
-
161
-
162
-
163
-
164
-
165
-
166
-
167
-
168
-
169
-
170
-
171
-
172
 |
 |

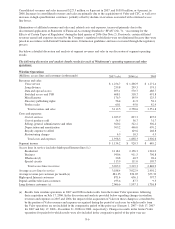
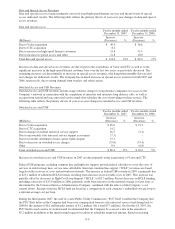
Data and Special Access Revenues
Data and special access revenues primarily consist of retail high-speed Internet services and the provision of special
access dedicated circuits. The following table reflects the primary drivers of year-over-year changes in data and special
access revenues:
Data and special access
Twelve months ended
December 31, 2007
Twelve months ended
December 31, 2006
(Millions)
Increase
(Decrease) %
Increase
(Decrease) %
Due to Valor acquisition $ 49.4 $ 36.6
Due to CTC acquisition 8.4 -
Due to increases in high-speed Internet customers 53.8 35.4
Due to increase in special access and other 12.8 10.0
Total data and special access $ 124.4 22% $ 82.0 17%
Increases in data and special access revenues are due in part to the acquisitions of Valor and CTC as well as to the
significant increases in the high-speed Internet customer base over the last two years, as previously discussed. The
remaining increases are due primarily to increases in special access revenues, which represent monthly flat-rate end
user charges for dedicated circuits. The Company has realized increases in special access revenues in both 2007 and
2006, respectively, due to strong demand from wireless and other carriers.
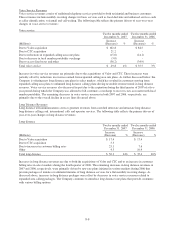
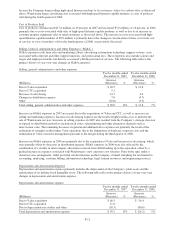
Switched Access and USF Revenues
Switched access and USF revenues include usage sensitive charges to long distance companies for access to the
Company’s network in connection with the completion of interstate and intrastate long distance calls, as well as
receipts from federal and state universal service funds that subsidize the cost of providing wireline services. The
following table reflects the primary drivers of year-over-year changes in switched access and USF revenues:
Switched access and USF
Twelve months ended
December 31, 2007
Twelve months ended
December 31, 2006
(Millions)
Increase
(Decrease) %
Increase
(Decrease) %
Due to Valor acquisition $ 85.6 $ 72.3
Due to CTC acquisition 14.2 -
Due to changes in federal universal service support 16.5 (5.2)
Due to unfavorable state universal service support assessment (7.3) -
Due to favorable settlement of inter-carrier traffic dispute 13.3 -
Due to decreases in switched access charges (33.8) (33.4)
Other 0.9 (6.8)
Total switched access and USF $ 89.4 17% $ 26.9 5%
Increases in switched access and USF revenues in 2007 are due primarily to the acquisitions of Valor and CTC.
Federal USF programs, including common line and high-cost support, provide federal subsidies to cover the costs of
services in order to keep basic service rates affordable. Interstate common line support (“ICLS”) revenues are based
largely on the recovery of costs and network investments. The increase in federal USF revenue in 2007 is primarily due
to $25.1 million of additional ICLS revenues resulting from increases in recoverable costs in 2007. This increase was
partially offset by decreases in High-Cost Loop Support (“HCLS”) of $5.3 million. Recent decreases in HCLS funding,
including a decrease of $13.9 million in 2006, primarily result from increases in the national average cost per loop, as
determined by the Universal Service Administrative Company, combined with the effects of the Company’s cost
control efforts. Receipts from the HCLS fund are based on a comparison of each company’s embedded cost per loop to
a national average cost per loop.
During the third quarter 2007, the staff of a state Public Utility Commission (“PUC Staff”) notified the Company that
the PUC Staff believed the Company had been over-compensated from its state universal service fund dating back to
2000 by the amount of $6.1 million plus interest of $1.2 million (for a total $7.3 million). On October 18, 2007, the
PUC Staff issued a notice of violation and recommended that the Company be assessed a fine in the amount of
$5.2 million in addition to the initial refund request for failure to refund the requested amount. Based on existing
F-9