Windstream 2007 Annual Report Download - page 98
Download and view the complete annual report
Please find page 98 of the 2007 Windstream annual report below. You can navigate through the pages in the report by either clicking on the pages listed below, or by using the keyword search tool below to find specific information within the annual report.-
 1
1 -
2
-
3
-
4
-
5
-
6
-
7
-
8
-
9
-
10
-
11
-
12
-
13
-
14
-
15
-
16
-
17
-
18
-
19
-
20
-
21
-
22
-
23
-
24
-
25
-
26
-
27
-
28
-
29
-
30
-
31
-
32
-
33
-
34
-
35
-
36
-
37
-
38
-
39
-
40
-
41
-
42
-
43
-
44
-
45
-
46
-
47
-
48
-
49
-
50
-
51
-
52
-
53
-
54
-
55
-
56
-
57
-
58
-
59
-
60
-
61
-
62
-
63
-
64
-
65
-
66
-
67
-
68
-
69
-
70
-
71
-
72
-
73
-
74
-
75
-
76
-
77
-
78
-
79
-
80
-
81
-
82
-
83
-
84
-
85
-
86
-
87
-
 88
88 -
 89
89 -
 90
90 -
 91
91 -
 92
92 -
 93
93 -
 94
94 -
 95
95 -
 96
96 -
 97
97 -
 98
98 -
 99
99 -
 100
100 -
 101
101 -
 102
102 -
 103
103 -
 104
104 -
 105
105 -
 106
106 -
 107
107 -
 108
108 -
109
-
110
-
111
-
112
-
113
-
114
-
115
-
116
-
117
-
118
-
119
-
120
-
121
-
122
-
123
-
124
-
125
-
126
-
127
-
128
-
129
-
130
-
131
-
132
-
133
-
134
-
135
-
136
-
137
-
138
-
139
-
140
-
141
-
142
-
143
-
144
-
145
-
146
-
147
-
148
-
149
-
150
-
151
-
152
-
153
-
154
-
155
-
156
-
157
-
158
-
159
-
160
-
161
-
162
-
163
-
164
-
165
-
166
-
167
-
168
-
169
-
170
-
171
-
172
 |
 |

because the Company began selling high-speed Internet modems to its customers, subject to a rebate offer as discussed
above, Windstream began classifying costs associated with high-speed Internet-capable modems as costs of products
sold during the fourth quarter of 2006.
Cost of Products Sold
Cost of products sold increased $17.8 million, or 49 percent, in 2007 and increased $5.0 million, or 16 percent, in 2006,
primarily due to costs associated with sales of high-speed Internet-capable modems, as well as due to an increase in
customer premise equipment sales to retail customers as discussed above. The increase in costs associated with high-
speed Internet-capable modems of $9.9 million is primarily due to the change in classification of these costs from cost
of services to costs of products sold in the fourth quarter of 2006, as previously discussed.
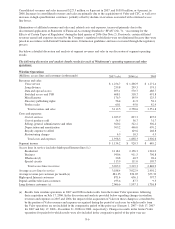
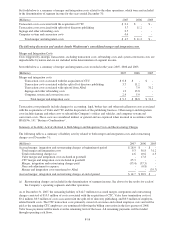
Selling, General, Administrative and Other Expenses (“SG&A”)
SG&A expenses result from sales and marketing efforts, advertising, information technology support systems, costs
associated with corporate and other support functions, and professional fees. These expenses also include salaries and
wages and employee benefits not directly associated with the provision of services. The following table reflects the
primary drivers of year-over-year changes in SG&A expenses:
Selling, general, administrative and other expenses
Twelve months ended
December 31, 2007
Twelve months ended
December 31, 2006
(Millions)
Increase
(Decrease) %
Increase
(Decrease) %
Due to Valor acquisition $ 20.5 $ 21.8
Due to CTC acquisition 5.2 -
Increases in advertising 14.7 6.0
Changes in distribution expense 7.6 (4.7)
Other (10.0) (3.3)
Total selling, general, administrative and other expenses $ 38.0 12% $ 19.8 7%
Increases in SG&A expenses in 2007 are in part due to the acquisitions of Valor and CTC, as well as increases in
selling and marketing expenses. Increases in advertising expense are the result of higher media costs to promote the
sale of Windstream services. Increases in selling expenses in 2007 also resulted from the Company’s strategic decision
to expand its distribution network to include retail stores, telemarketing and other alternative channels such as
door-to-door sales. The remaining decreases in general and administrative expenses are primarily the result of the
realization of synergies in the former Valor operations due to the elimination of duplicate corporate costs and the
termination of Valor executive management pursuant to the merger during the third quarter of 2006.
Increases in SG&A expenses in 2006 are primarily due to the acquisition of Valor and increases in advertising, which
were partially offset by decreases in distribution expense. SG&A expenses in 2006 were also affected by the
combination of a decline in intercompany allocations received from Alltel leading up to the separation, offset by a
gradual increase in expenses associated with Windstream’s new corporate cost structure. Prior to the spin, under a
shared services arrangement, Alltel provided certain functions on the Company’s behalf, including but not limited to
accounting, marketing, customer billing, information technology, legal, human resources, and engineering services.
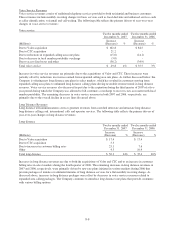
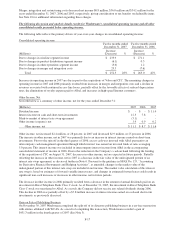
Depreciation and Amortization Expense
Depreciation and amortization expense primarily includes the depreciation of the Company’s plant assets and the
amortization of its definite-lived intangible assets. The following table reflects the primary drivers of year-over-year
changes in depreciation and amortization expense:
Depreciation and amortization expense
Twelve months ended
December 31, 2007
Twelve months ended
December 31, 2006
(Millions)
Increase
(Decrease) %
Increase
(Decrease) %
Due to Valor acquisition $ 66.5 $ 56.4
Due to CTC acquisition 11.0 -
Due to depreciation rate studies and other (18.3) (80.6)
Total depreciation and amortization expense $ 59.2 13% $ (24.2) 5%
F-12