3M 2013 Annual Report Download - page 119
Download and view the complete annual report
Please find page 119 of the 2013 3M annual report below. You can navigate through the pages in the report by either clicking on the pages listed below, or by using the keyword search tool below to find specific information within the annual report.-
 1
1 -
2
-
3
-
4
-
5
-
6
-
7
-
8
-
9
-
10
-
11
-
12
-
13
-
14
-
15
-
16
-
17
-
18
-
19
-
20
-
21
-
22
-
23
-
24
-
25
-
26
-
27
-
28
-
29
-
30
-
31
-
32
-
33
-
34
-
35
-
36
-
37
-
38
-
39
-
40
-
41
-
42
-
43
-
44
-
45
-
46
-
47
-
48
-
49
-
50
-
51
-
52
-
53
-
54
-
55
-
56
-
57
-
58
-
59
-
60
-
61
-
62
-
63
-
64
-
65
-
66
-
67
-
68
-
69
-
70
-
71
-
72
-
73
-
74
-
75
-
76
-
77
-
78
-
79
-
80
-
81
-
82
-
83
-
84
-
85
-
86
-
87
-
88
-
89
-
90
-
91
-
92
-
93
-
94
-
95
-
96
-
97
-
98
-
99
-
100
-
101
-
102
-
103
-
104
-
105
-
106
-
107
-
108
-
 109
109 -
 110
110 -
 111
111 -
 112
112 -
 113
113 -
 114
114 -
 115
115 -
 116
116 -
 117
117 -
 118
118 -
 119
119 -
 120
120 -
 121
121 -
 122
122 -
 123
123 -
 124
124 -
 125
125 -
 126
126 -
 127
127 -
 128
128 -
 129
129 -
130
-
131
-
132
 |
 |

113
the expected life volatility of 3M stock, and the implied volatility on the grant date. The expected term assumption is based
on the weighted average of historical grants.
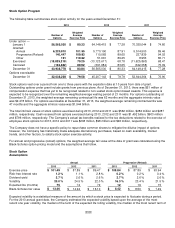
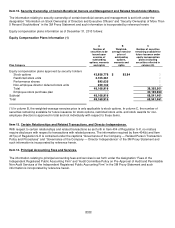
Restricted Stock and Restricted Stock Units
The following table summarizes restricted stock and restricted stock unit activity for the years ended December 31:
2013
2012
2011
Weighted
Average
Weighted
Average
Weighted
Average
Number of
Grant Date
Number of
Grant Date
Number of
Grant Date
Awards Fair Value Awards Fair Value
Awards Fair Value
Nonvested balance —
As of January 1
3,261,562
$
85.17
4,858,972 $
73.02 4,812,657 $
68.75
Granted
Annual
946,774
101.57
968,522 87.92 889,448 89.46
Other 44,401 111.19 99,337 85.07 351,624 87.07
Vested
(1,100,095) 79.93 (2,594,468) 63.51 (1,077,816) 72.21
Forfeited (47,281) 90.82 (70,801) 82.65 (116,941) 72.01
As of December 31 3,105,361 $
92.31 3,261,562 $
85.17 4,858,972 $
73.02
As of December 31, 2013, there was $77 million of compensation expense that has yet to be recognized related to non-
vested restricted stock and restricted stock units. This expense is expected to be recognized over the remaining weighted-
average vesting period of 24 months. The total fair value of restricted stock and restricted stock units that vested during
the years ended December 31, 2013, 2012 and 2011 was $114 million, $228 million and $102 million, respectively. The
Company’s actual tax benefits realized for the tax deductions related to the vesting of restricted stock and restricted stock
units for the years ended December 31, 2013, 2012 and 2011 was $43 million, $86 million and $36 million, respectively.
Restricted stock units granted under the 3M 2008 Long-Term Incentive Plan generally vest three years following the grant
date assuming continued employment. Dividend equivalents equal to the dividends payable on the same number of
shares of 3M common stock accrue on these restricted stock units during the vesting period, although no dividend
equivalents are paid on any of these restricted stock units that are forfeited prior to the vesting date. Dividends are paid
out in cash at the vest date on restricted stock units, except for performance shares which do not earn dividends. Since
the rights to dividends are forfeitable, there is no impact on basic earnings per share calculations. Weighted average
restricted stock unit shares outstanding are included in the computation of diluted earnings per share.
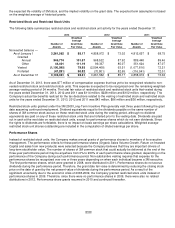
Performance Shares
Instead of restricted stock units, the Company makes annual grants of performance shares to members of its executive
management. The performance criteria for these performance shares (Organic Sales Volume Growth, Return on Invested
Capital and sales from new products) were selected because the Company believes that they are important drivers of
long-term stockholder value. The number of shares of 3M common stock that could actually be delivered at the end of the
three-year performance period may be anywhere from 0% to 200% of each performance share granted, depending on the
performance of the Company during such performance period. Non-substantive vesting requires that expense for the
performance shares be recognized over one or three years depending on when each individual became a 3M executive.
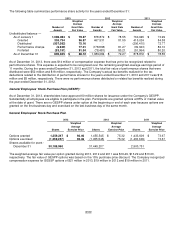
The first performance shares, which were granted in 2008, were distributed in 2011. Performance shares do not accrue
dividends during the performance period. Therefore, the grant date fair value is determined by reducing the closing stock
price on the date of grant by the net present value of dividends during the performance period. As a result of the
significant uncertainty due to the economic crisis of 2008-2009, the Company granted restricted stock units instead of
performance shares in 2009. Therefore, since there were no performance shares in 2009, there were also no related
distributions in 2012. Performance share grants resumed in 2010 and continued thereafter.