3M 2013 Annual Report Download - page 93
Download and view the complete annual report
Please find page 93 of the 2013 3M annual report below. You can navigate through the pages in the report by either clicking on the pages listed below, or by using the keyword search tool below to find specific information within the annual report.-
 1
1 -
2
-
3
-
4
-
5
-
6
-
7
-
8
-
9
-
10
-
11
-
12
-
13
-
14
-
15
-
16
-
17
-
18
-
19
-
20
-
21
-
22
-
23
-
24
-
25
-
26
-
27
-
28
-
29
-
30
-
31
-
32
-
33
-
34
-
35
-
36
-
37
-
38
-
39
-
40
-
41
-
42
-
43
-
44
-
45
-
46
-
47
-
48
-
49
-
50
-
51
-
52
-
53
-
54
-
55
-
56
-
57
-
58
-
59
-
60
-
61
-
62
-
63
-
64
-
65
-
66
-
67
-
68
-
69
-
70
-
71
-
72
-
73
-
74
-
75
-
76
-
77
-
78
-
79
-
80
-
81
-
82
-
 83
83 -
 84
84 -
 85
85 -
 86
86 -
 87
87 -
 88
88 -
 89
89 -
 90
90 -
 91
91 -
 92
92 -
 93
93 -
 94
94 -
 95
95 -
 96
96 -
 97
97 -
 98
98 -
 99
99 -
 100
100 -
 101
101 -
 102
102 -
 103
103 -
104
-
105
-
106
-
107
-
108
-
109
-
110
-
111
-
112
-
113
-
114
-
115
-
116
-
117
-
118
-
119
-
120
-
121
-
122
-
123
-
124
-
125
-
126
-
127
-
128
-
129
-
130
-
131
-
132
 |
 |

87
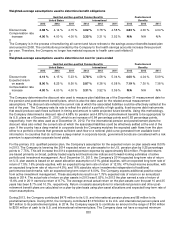
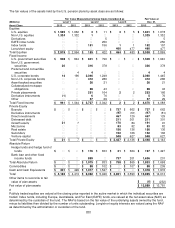
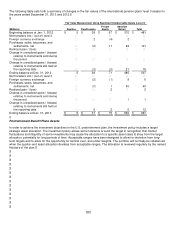
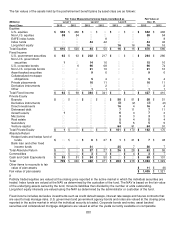
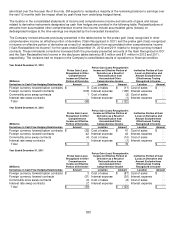
The fair values of the assets held by the postretirement benefit plans by asset class are as follows:
Fair Value Measurements Using Inputs Considered as
Fair Value at
(Millions)
Level 1
Level 2
Level 3
Dec. 31,
Asset Class
2013
2012
2013
2012
2013
2012
2013
2012
Equities
U.S. equities
$
552
$ 466
$
―
$ ―
$
―
$ ―
$
552
$
466
Non-U.S. equities
58
54
―
―
―
―
58
54
EAFE index funds
―
―
―
8
―
―
―
8
Index funds
―
―
44
42
―
―
44
42
Long/short equity
―
―
―
―
16
16
16
16
Total Equities
$
610
$ 520
$
44
$ 50
$
16
$
16
$
670
$
586
Fixed Income
U.S. government securities
$
62
$ 63
$
202
$ 217
$
―
$ ―
$
264
$
280
Non-U.S. government
securities
1
―
14
16
―
―
15
16
U.S. corporate bonds
―
6
96
68
―
―
96
74
Non-U.S. corporate bonds
―
―
21
16
―
―
21
16
Asset-backed securities
―
―
9
6
―
―
9
6
Collateralized mortgage
obligations
―
―
5
4
―
―
5
4
Private placements
―
―
16
11
―
―
16
11
Derivative instruments
―
―
―
2
―
―
―
2
Other
―
―
1
1
―
―
1
1
Total Fixed Income
$
63
$ 69
$
364
$ 341
$
―
$
―
$
427
$
410
Private Equity
Buyouts
$
―
$ ―
$
―
$ ―
$
58
$ 51
$
58
$
51
Derivative instruments
―
―
―
―
(3)
(2)
(3)
(2)
Direct investments
―
―
―
―
16
4
16
4
Distressed debt
―
―
―
―
7
11
7
11
Growth equity
1
―
―
―
6
3
7
3
Mezzanine
―
―
―
―
3
3
3
3
Real estate
―
―
―
―
5
4
5
4
Secondary
―
―
―
―
5
5
5
5
Venture capital
―
―
―
―
64
91
64
91
Total Private Equity
$
1
$ ―
$
―
$ ―
$
161
$
170
$
162
$
170
Absolute Return
Hedge funds and hedge fund of
funds
$
―
$ ―
$
6
$ 27
$
1
$ 21
$
7
$
48
Bank loan and other fixed
income funds
―
―
31
―
25
7
56
7
Total Absolute Return
$
―
$ ―
$
37
$ 27
$
26
$
28
$
63
$
55
Commodities
$
―
$ ―
$
3
$ 3
$
―
$
4
$
3
$
7
Cash and Cash Equivalents
$
35
$ 51
$
34
$ 50
$
―
$
―
$
69
$
101
Total
$
709
$ 640
$
482
$ 471
$
203
$
218
$
1,394
$
1,329
Other items to reconcile to fair
value of plan assets
$
11
$
(8)
Fair value of plan assets
$
1,405
$
1,321
Publicly traded equities are valued at the closing price reported in the active market in which the individual securities are
traded. Index funds are valued at the NAV as determined by the custodian of the fund. The NAV is based on the fair value
of the underlying assets owned by the fund, minus its liabilities then divided by the number of units outstanding.
Long/short equity interests are valued using the NAV as determined by the administrator or custodian of the fund.
Fixed income includes derivative investments such as credit default swaps, interest rate swaps and futures contracts that
are used to help manage risks. U.S. government and government agency bonds and notes are valued at the closing price
reported in the active market in which the individual security is traded. Corporate bonds and notes, asset backed
securities and collateralized mortgage obligations are valued at either the yields currently available on comparable