3M 2013 Annual Report Download - page 55
Download and view the complete annual report
Please find page 55 of the 2013 3M annual report below. You can navigate through the pages in the report by either clicking on the pages listed below, or by using the keyword search tool below to find specific information within the annual report.-
 1
1 -
2
-
3
-
4
-
5
-
6
-
7
-
8
-
9
-
10
-
11
-
12
-
13
-
14
-
15
-
16
-
17
-
18
-
19
-
20
-
21
-
22
-
23
-
24
-
25
-
26
-
27
-
28
-
29
-
30
-
31
-
32
-
33
-
34
-
35
-
36
-
37
-
38
-
39
-
40
-
41
-
42
-
43
-
44
-
 45
45 -
 46
46 -
 47
47 -
 48
48 -
 49
49 -
 50
50 -
 51
51 -
 52
52 -
 53
53 -
 54
54 -
 55
55 -
 56
56 -
 57
57 -
 58
58 -
 59
59 -
 60
60 -
 61
61 -
 62
62 -
 63
63 -
 64
64 -
 65
65 -
66
-
67
-
68
-
69
-
70
-
71
-
72
-
73
-
74
-
75
-
76
-
77
-
78
-
79
-
80
-
81
-
82
-
83
-
84
-
85
-
86
-
87
-
88
-
89
-
90
-
91
-
92
-
93
-
94
-
95
-
96
-
97
-
98
-
99
-
100
-
101
-
102
-
103
-
104
-
105
-
106
-
107
-
108
-
109
-
110
-
111
-
112
-
113
-
114
-
115
-
116
-
117
-
118
-
119
-
120
-
121
-
122
-
123
-
124
-
125
-
126
-
127
-
128
-
129
-
130
-
131
-
132
 |
 |

49
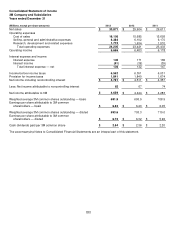
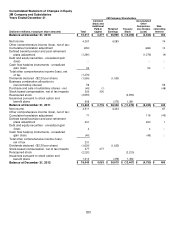
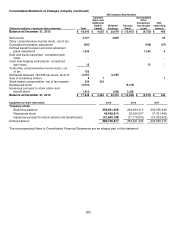
Consolidated Statement of Changes in Equity
3M Company and Subsidiaries
Years Ended December 31
3M Company Shareholders
(Dollars in millions, except per share amounts)
Total
Common
Stock and
Additional
Paid-in
Capital
Retained
Earnings
Treasury
Stock
Accumulated
Other
Comprehen-
sive Income
(Loss)
Non-
controlling
Interest
Balance at December 31, 2010
$
16,017
$
3,477
$
25,995
$
(10,266)
$
(3,543)
$
354
Net income
4,357
4,283
74
Other comprehensive income (loss), net of tax:
Cumulative translation adjustment
(250)
(260)
10
Defined benefit pension and post-retirement
plans adjustment
(1,280)
(1,276)
(4)
Debt and equity securities - unrealized gain
(loss)
―
―
―
Cash flow hedging instruments - unrealized
gain (loss)
54
54
―
Total other comprehensive income (loss), net
of tax
(1,476)
Dividends declared ($2.20 per share)
(1,555)
(1,555)
Business combination allocation to
noncontrolling interest
56
56
Purchase and sale of subsidiary shares - net
(49)
(1)
(48)
Stock-based compensation, net of tax impacts
300
300
Reacquired stock
(2,694)
(2,694)
Issuances pursuant to stock option and
benefit plans
906
(375)
1,281
Balance at December 31, 2011
$
15,862
$
3,776
$
28,348
$
(11,679)
$
(5,025)
$
442
Net income
4,511
4,444
67
Other comprehensive income (loss), net of tax:
Cumulative translation adjustment
71
116
(45)
Defined benefit pension and post-retirement
plans adjustment
201
200
1
Debt and equity securities - unrealized gain
(loss)
4
4
―
Cash flow hedging instruments - unrealized
gain (loss)
(45)
(45)
―
Total other comprehensive income (loss),
net of tax
231
Dividends declared ($2.36 per share)
(1,635)
(1,635)
Stock-based compensation, net of tax impacts
277
277
Reacquired stock
(2,220)
(2,220)
Issuances pursuant to stock option and
benefit plans
1,014
(478)
1,492
Balance at December 31, 2012
$
18,040
$
4,053
$
30,679
$
(12,407)
$
(4,750)
$
465