3M 2013 Annual Report Download - page 88
Download and view the complete annual report
Please find page 88 of the 2013 3M annual report below. You can navigate through the pages in the report by either clicking on the pages listed below, or by using the keyword search tool below to find specific information within the annual report.-
 1
1 -
2
-
3
-
4
-
5
-
6
-
7
-
8
-
9
-
10
-
11
-
12
-
13
-
14
-
15
-
16
-
17
-
18
-
19
-
20
-
21
-
22
-
23
-
24
-
25
-
26
-
27
-
28
-
29
-
30
-
31
-
32
-
33
-
34
-
35
-
36
-
37
-
38
-
39
-
40
-
41
-
42
-
43
-
44
-
45
-
46
-
47
-
48
-
49
-
50
-
51
-
52
-
53
-
54
-
55
-
56
-
57
-
58
-
59
-
60
-
61
-
62
-
63
-
64
-
65
-
66
-
67
-
68
-
69
-
70
-
71
-
72
-
73
-
74
-
75
-
76
-
77
-
 78
78 -
 79
79 -
 80
80 -
 81
81 -
 82
82 -
 83
83 -
 84
84 -
 85
85 -
 86
86 -
 87
87 -
 88
88 -
 89
89 -
 90
90 -
 91
91 -
 92
92 -
 93
93 -
 94
94 -
 95
95 -
 96
96 -
 97
97 -
 98
98 -
99
-
100
-
101
-
102
-
103
-
104
-
105
-
106
-
107
-
108
-
109
-
110
-
111
-
112
-
113
-
114
-
115
-
116
-
117
-
118
-
119
-
120
-
121
-
122
-
123
-
124
-
125
-
126
-
127
-
128
-
129
-
130
-
131
-
132
 |
 |

82
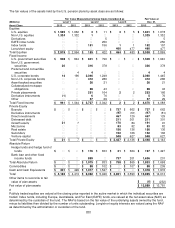
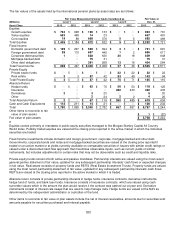
The fair values of the assets held by the U.S. pension plans by asset class are as follows:
Fair Value Measurements Using Inputs Considered as
Fair Value at
(Millions)
Level 1
Level 2
Level 3
Dec. 31,
Asset Class
2013
2012
2013
2012
2013
2012
2013
2012
Equities
U.S. equities
$
1,595
$ 1,662
$
3
$ 11
$
3
$ 5
$
1,601
$
1,678
Non-U.S. equities
1,324
1,332
1
―
―
―
1,325
1,332
Derivatives
―
―
―
5
―
―
―
5
EAFE index funds
―
―
―
250
―
―
―
250
Index funds
―
―
151
156
1
1
152
157
Long/short equity
―
―
―
―
460
477
460
477
Total Equities
$
2,919
$ 2,994
$
155
$ 422
$
464
$
483
$
3,538
$
3,899
Fixed Income
U.S. government securities
$
908
$ 844
$
601
$ 796
$
―
$ ―
$
1,509
$
1,640
Non-U.S. government
securities
20
―
316
378
―
―
336
378
Preferred and convertible
securities
―
4
4
―
―
―
4
4
U.S. corporate bonds
14
196
2,046
1,249
―
―
2,060
1,445
Non-U.S. corporate bonds
―
―
412
286
―
―
412
286
Asset-backed securities
―
―
26
21
―
―
26
21
Collateralized mortgage
obligations
―
―
28
43
―
―
28
43
Private placements
―
―
251
164
2
2
253
166
Derivative instruments
(1)
―
6
76
―
―
5
76
Other
―
―
37
29
―
―
37
29
Total Fixed Income
$
941
$ 1,044
$
3,727
$ 3,042
$
2
$
2
$
4,670
$
4,088
Private Equity
Buyouts
$
―
$ ―
$
―
$ ―
$
737
$ 662
$
737
$
662
Derivative instruments
―
―
―
―
(97)
(51)
(97)
(51)
Direct investments
―
―
―
―
467
129
467
129
Distressed debt
―
―
―
―
211
301
211
301
Growth equity
21
7
―
―
170
84
191
91
Mezzanine
―
―
―
―
83
82
83
82
Real estate
―
―
―
―
156
136
156
136
Secondary
―
―
―
―
152
166
152
166
Venture capital
―
―
―
―
548
627
548
627
Total Private Equity
$
21
$ 7
$
―
$ ―
$
2,427
$
2,136
$
2,448
$
2,143
Absolute Return
Hedge funds and hedge fund of
funds
$ ―
$ ―
$ 176
$ 833
$ 21
$ 664
$ 197
$
1,497
Bank loan and other fixed
income funds
―
―
899
―
737
201
1,636 201
Total Absolute Return
$ ―
$ ―
$ 1,075
$ 833
$ 758
$ 865
$ 1,833
$
1,698
Commodities
$ ―
$ ―
$ 88
$ 102
$ ―
$ 107
$ 88
$
209
Cash and Cash Equivalents
$ 301
$ 429
$ 1,017
$ 1,547
$ ―
$ ―
$ 1,318
$
1,976
Total
$ 4,182
$ 4,474
$ 6,062
$ 5,946
$ 3,651
$ 3,593
$ 13,895
$
14,013
Other items to reconcile to fair
value of plan assets
$ (6)
$
(232)
Fair value of plan assets
$ 13,889
$
13,781
Publicly traded equities are valued at the closing price reported in the active market in which the individual securities are
traded. Index funds, including Europe, Australasia, and Far East (EAFE) funds, are valued at the net asset value (NAV) as
determined by the custodian of the fund. The NAV is based on the fair value of the underlying assets owned by the fund,
minus its liabilities then divided by the number of units outstanding. Long/short equity interests are valued using the NAV
as determined by the administrator or custodian of the fund.