3M 2013 Annual Report Download - page 22
Download and view the complete annual report
Please find page 22 of the 2013 3M annual report below. You can navigate through the pages in the report by either clicking on the pages listed below, or by using the keyword search tool below to find specific information within the annual report.-
 1
1 -
2
-
3
-
4
-
5
-
6
-
7
-
8
-
9
-
10
-
11
-
 12
12 -
 13
13 -
 14
14 -
 15
15 -
 16
16 -
 17
17 -
 18
18 -
 19
19 -
 20
20 -
 21
21 -
 22
22 -
 23
23 -
 24
24 -
 25
25 -
 26
26 -
 27
27 -
 28
28 -
 29
29 -
 30
30 -
 31
31 -
 32
32 -
33
-
34
-
35
-
36
-
37
-
38
-
39
-
40
-
41
-
42
-
43
-
44
-
45
-
46
-
47
-
48
-
49
-
50
-
51
-
52
-
53
-
54
-
55
-
56
-
57
-
58
-
59
-
60
-
61
-
62
-
63
-
64
-
65
-
66
-
67
-
68
-
69
-
70
-
71
-
72
-
73
-
74
-
75
-
76
-
77
-
78
-
79
-
80
-
81
-
82
-
83
-
84
-
85
-
86
-
87
-
88
-
89
-
90
-
91
-
92
-
93
-
94
-
95
-
96
-
97
-
98
-
99
-
100
-
101
-
102
-
103
-
104
-
105
-
106
-
107
-
108
-
109
-
110
-
111
-
112
-
113
-
114
-
115
-
116
-
117
-
118
-
119
-
120
-
121
-
122
-
123
-
124
-
125
-
126
-
127
-
128
-
129
-
130
-
131
-
132
 |
 |
16
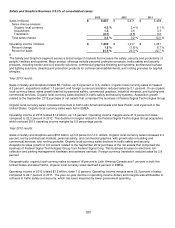
For total year 2013, net income attributable to 3M was $4.659 billion, or $6.72 per diluted share, compared to $4.444
billion, or $6.32 per diluted share, in 2012, an increase of 6.3 percent on a per diluted share basis. Sales totaled $30.9
billion, an increase of 3.2 percent from 2012. From a business segment perspective, organic local-currency sales growth
was 5.0 percent in Health Care, 4.6 percent in Industrial, 4.2 percent in Safety and Graphics, 3.0 percent in Consumer,
and was flat in Electronics and Energy. From a geographic area perspective, 2013 organic local-currency sales growth
was 7.1 percent in Latin America/Canada, 3.6 percent in Asia Pacific, 3.1 percent in the United States, and 2.1 percent in
EMEA. For the Company in total, organic local-currency sales grew 3.4 percent, with higher organic volumes contributing
2.5 percent and selling price increases contributing 0.9 percent. Acquisitions added 1.4 percent to sales, driven by the
November 2012 acquisition of Ceradyne, Inc. (Industrial), the September 2012 purchase of the net assets that comprised
the business of Federal Signal Technologies Group (Safety and Graphics), and the April 2012 acquisition of CodeRyte,
Inc. (Health Care). Foreign currency translation reduced sales by 1.6 percent year-on-year.
Operating income in 2013 was 21.6 percent of sales, compared to 21.7 percent of sales in 2012, a decline of 0.1
percentage points. Items that reduced operating income margins included lower factory utilization/productivity, strategic
investments (including business transformation, enabled by 3M’s global ERP implementation), the impact of 2012
acquisitions, and other factors. These factors were largely offset by the combination of selling price increases and raw
material cost decreases, in addition to lower pension/postretirement benefit costs. Refer to the section entitled “Results of
Operations” for further discussion.
The income tax rate was 28.1 percent in 2013, down 0.9 percentage points versus 2012, which increased earnings per
diluted share by approximately 9 cents. Weighted-average diluted shares outstanding in 2013 declined 1.4 percent year-
on-year to 693.6 million, which increased earnings per diluted share by approximately 9 cents. Foreign exchange impacts
decreased earnings per diluted share by approximately 11 cents.
Fourth-quarter 2012 net income attributable to 3M was $991 million, or $1.41 per diluted share, compared to $954 million,
or $1.35 per diluted share, in the fourth quarter of 2011. Fourth-quarter 2012 sales totaled $7.4 billion, an increase of 4.2
percent from the fourth quarter of 2011. Organic local-currency sales grew 4.3 percent, acquisitions added 0.9 percent to
sales, and foreign currency translation reduced sales by 1.0 percent year-on-year. From a business segment perspective,
Consumer led with organic local-currency sales growth of 8.8 percent, driven by consumer health care, construction and
home improvement markets, and stationery and office supplies. Health Care organic local-currency sales grew 5.9
percent, with positive growth in all businesses, led by food safety, health information systems, critical and chronic care,
and oral care. Electronics and Energy organic local-currency sales growth was 4.4 percent, led by optical systems, with
sales also increasing in infrastructure protection, electrical, and telecommunication markets, partially offset by declines in
renewable energy and electronics markets materials. Industrial organic local-currency sales grew 4.4 percent, led by 3M
Purification Inc. (filtration products), aerospace, industrial adhesives and tapes, abrasives and automotive OEM partially
offset by declines in advanced materials. Organic local-currency sales declined 0.3 percent in Safety and Graphics, as
sales growth in personal safety, architectural markets, commercial graphics, and roofing granules was offset by a year-on-
year decline in traffic safety and security systems.
From a geographic area perspective, fourth-quarter 2012 organic local-currency sales growth was 9.9 percent in Latin
America/Canada, 5.8 percent in Asia Pacific, and 5.2 percent in the United States. EMEA organic local-currency sales
declined 1.0 percent, impacted by a weak economy in Western Europe. Latin America/Canada sales growth was broad-
based, with all five business segments generating positive organic local-currency sales growth, led by Health Care; Safety
and Graphics; Electronics and Energy; and Consumer. Organic local-currency sales growth increased 11 percent in
Brazil, in the face of a still-recovering economy, and Mexico grew nearly 10 percent. In Asia Pacific, Japan declined year-
on-year, reflecting continued challenging economic conditions. Organic local-currency sales in the rest of Asia Pacific
grew nearly 10 percent, with China up over 16 percent. Organic local-currency sales growth in the United States was led
by Consumer.
For total year 2012, net income attributable to 3M was $4.444 billion, or $6.32 per diluted share, compared to $4.283
billion, or $5.96 per diluted share, in 2011, an increase of 6.0 percent on a per diluted share basis. Sales totaled $29.9
billion, an increase of 1.0 percent from 2011. Organic local-currency sales grew 2.6 percent, acquisitions added 0.8
percent to sales and foreign currency translation reduced sales by 2.4 percent year-on-year. From a business segment
perspective, organic local-currency sales growth was 5.2 percent in Industrial, 4.7 percent in Health Care, 3.6 percent in
Consumer, and 2.4 percent in Safety and Graphics. Organic local-currency sales declined 3.7 percent in Electronics and
Energy. From a geographic area perspective, 2012 organic local-currency sales growth was 11.1 percent in Latin
America/Canada, 4.2 percent in the United States, and 0.1 percent in Asia Pacific. Asia Pacific was impacted by a soft
global consumer electronics industry. EMEA organic local-currency sales declined 0.6 percent, impacted by a weak
economy in Western Europe.