3M 2013 Annual Report Download - page 83
Download and view the complete annual report
Please find page 83 of the 2013 3M annual report below. You can navigate through the pages in the report by either clicking on the pages listed below, or by using the keyword search tool below to find specific information within the annual report.-
 1
1 -
2
-
3
-
4
-
5
-
6
-
7
-
8
-
9
-
10
-
11
-
12
-
13
-
14
-
15
-
16
-
17
-
18
-
19
-
20
-
21
-
22
-
23
-
24
-
25
-
26
-
27
-
28
-
29
-
30
-
31
-
32
-
33
-
34
-
35
-
36
-
37
-
38
-
39
-
40
-
41
-
42
-
43
-
44
-
45
-
46
-
47
-
48
-
49
-
50
-
51
-
52
-
53
-
54
-
55
-
56
-
57
-
58
-
59
-
60
-
61
-
62
-
63
-
64
-
65
-
66
-
67
-
68
-
69
-
70
-
71
-
72
-
 73
73 -
 74
74 -
 75
75 -
 76
76 -
 77
77 -
 78
78 -
 79
79 -
 80
80 -
 81
81 -
 82
82 -
 83
83 -
 84
84 -
 85
85 -
 86
86 -
 87
87 -
 88
88 -
 89
89 -
 90
90 -
 91
91 -
 92
92 -
 93
93 -
94
-
95
-
96
-
97
-
98
-
99
-
100
-
101
-
102
-
103
-
104
-
105
-
106
-
107
-
108
-
109
-
110
-
111
-
112
-
113
-
114
-
115
-
116
-
117
-
118
-
119
-
120
-
121
-
122
-
123
-
124
-
125
-
126
-
127
-
128
-
129
-
130
-
131
-
132
 |
 |

77
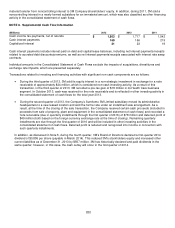
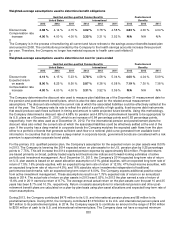
and CFTC (Commodity Futures Trading Commission). In March 2011, over the objections of 3M and six other limited
partners of WG Trading Company, the district court judge ruled in favor of the court appointed receiver’s proposed
distribution plan (and in April 2013, the United States Court of Appeals for the Second Circuit affirmed the district court’s
ruling). The benefit plan trustee holdings of WG Trading Company interests were adjusted to reflect the decreased
estimated fair market value, inclusive of estimated insurance proceeds, as of the annual measurement dates. The
Company has insurance that it believes, based on what is currently known, will result in the probable recovery of a portion
of the decrease in original asset value. As of the 2013 measurement date these holdings represented less than one
percent of 3M’s fair value of total plan assets. 3M currently believes that the resolution of these events will not have a
material adverse effect on the consolidated financial position of the Company.
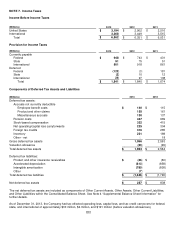
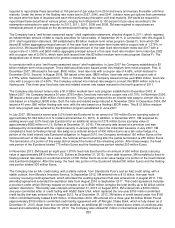
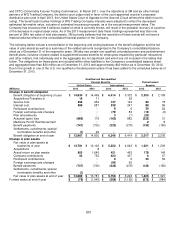
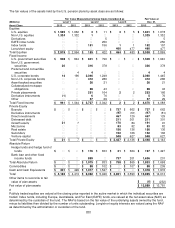
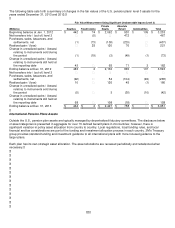
The following tables include a reconciliation of the beginning and ending balances of the benefit obligation and the fair
value of plan assets as well as a summary of the related amounts recognized in the Company’s consolidated balance
sheet as of December 31 of the respective years. 3M also has certain non-qualified unfunded pension and postretirement
benefit plans, inclusive of plans related to supplement/excess benefits for employees impacted by particular relocations
and other matters, that individually and in the aggregate are not significant and which are not included in the tables that
follow. The obligations for these plans are included within other liabilities in the Company’s consolidated balance sheet
and aggregated less than $30 million as of December 31, 2013 and approximately $40 million as of December 30, 2012.
Due to the growth in one of the U.S. non-qualified unfunded pension plans it has been added to the schedules below as of
December 31, 2013.
Qualified and Non-qualified
Pension Benefits Postretirement
United States
International
Benefits
(Millions)
2013
2012
2013
2012
2013
2012
Change in benefit obligation
Benefit obligation at beginning of year
$
14,830
$ 14,499
$
6,414
$ 5,332
$
2,205
$ 2,108
Acquisitions/Transfers in
15
11
―
26
―
―
Service cost
258
254
147
124
80
78
Interest cost
598
587
238
247
88
86
Participant contributions
―
―
8
5
30
52
Foreign exchange rate changes
―
―
(79)
83
(13)
(2)
Plan amendments
―
―
3
(7)
(20)
―
Actuarial (gain) loss
(986)
179
(163)
882
(225)
31
Medicare Part D Reimbursement
―
―
―
―
2
8
Benefit payments
(747)
(726)
(222)
(278)
(130)
(156)
Settlements, curtailments, special
termination benefits and other
(1)
26
―
―
―
―
Benefit obligation at end of year
$
13,967
$ 14,830
$
6,346
$ 6,414
$
2,017
$ 2,205
Change in plan assets
Fair value of plan assets at
beginning of year
$
13,781
$ 12,102
$
5,222
$ 4,643
$
1,321
$ 1,209
Acquisitions
―
8
―
―
―
―
Actual return on plan assets
803
1,645
421
463
178
149
Company contributions
53
752
423
327
6
67
Participant contributions
―
―
8
5
30
52
Foreign exchange rate changes
―
―
(94)
62
―
―
Benefit payments
(747)
(726)
(222)
(278)
(130)
(156)
Settlements, curtailments, special
termination benefits and other
(1)
―
―
―
―
―
Fair value of plan assets at end of year
$
13,889
$
13,781
$
5,758
$ 5,222
$
1,405
$ 1,321
Funded status at end of year
$
(78)
$
(1,049)
$
(588)
$
(1,192)
$
(612)
$
(884)