3M 2013 Annual Report Download - page 48
Download and view the complete annual report
Please find page 48 of the 2013 3M annual report below. You can navigate through the pages in the report by either clicking on the pages listed below, or by using the keyword search tool below to find specific information within the annual report.-
 1
1 -
2
-
3
-
4
-
5
-
6
-
7
-
8
-
9
-
10
-
11
-
12
-
13
-
14
-
15
-
16
-
17
-
18
-
19
-
20
-
21
-
22
-
23
-
24
-
25
-
26
-
27
-
28
-
29
-
30
-
31
-
32
-
33
-
34
-
35
-
36
-
37
-
 38
38 -
 39
39 -
 40
40 -
 41
41 -
 42
42 -
 43
43 -
 44
44 -
 45
45 -
 46
46 -
 47
47 -
 48
48 -
 49
49 -
 50
50 -
 51
51 -
 52
52 -
 53
53 -
 54
54 -
 55
55 -
 56
56 -
 57
57 -
 58
58 -
59
-
60
-
61
-
62
-
63
-
64
-
65
-
66
-
67
-
68
-
69
-
70
-
71
-
72
-
73
-
74
-
75
-
76
-
77
-
78
-
79
-
80
-
81
-
82
-
83
-
84
-
85
-
86
-
87
-
88
-
89
-
90
-
91
-
92
-
93
-
94
-
95
-
96
-
97
-
98
-
99
-
100
-
101
-
102
-
103
-
104
-
105
-
106
-
107
-
108
-
109
-
110
-
111
-
112
-
113
-
114
-
115
-
116
-
117
-
118
-
119
-
120
-
121
-
122
-
123
-
124
-
125
-
126
-
127
-
128
-
129
-
130
-
131
-
132
 |
 |
42
Commodity Prices Risk:
Certain commodities the Company uses in the production of its products are exposed to market price risks. 3M manages
commodity price risks through negotiated supply contracts, price protection agreements and forward physical contracts.
The Company uses commodity price swaps relative to natural gas as cash flow hedges of forecasted transactions to
manage price volatility. Generally, the length of time over which 3M hedges its exposure to the variability in future cash
flows for its forecasted natural gas transactions is 12 months. 3M also enters into commodity price swaps that are not
designated in hedge relationships to offset, in part, the impacts of fluctuations in costs associated with the use of certain
precious metals.
The dollar equivalent gross notional amount of the Company’s natural gas commodity price swaps designated as cash
flow hedges and precious metal commodity price swaps not designated in hedge relationships were $19 million and $2
million, respectively, at December 31, 2013.
Value At Risk:
The value at risk analysis is performed annually. A Monte Carlo simulation technique was used to test the Company’s
exposure to changes in currency rates, interest rates, and commodity prices and assess the risk of loss or benefit in after-
tax earnings of financial instruments (primarily debt), derivatives and underlying exposures outstanding at December 31,
2013. The model (third-party bank dataset) used a 95 percent confidence level over a 12-month time horizon. The
exposure to changes in currency rates model used 18 currencies, interest rates related to four currencies, and commodity
prices related to five commodities. This model does not purport to represent what actually will be experienced by the
Company. This model does not include certain hedge transactions, because the Company believes their inclusion would
not materially impact the results. Foreign exchange rate risk of loss or benefit increased in 2013, primarily due to
increases in exposures, which is one of the key drivers in the valuation model. Interest rate volatility remained stable in
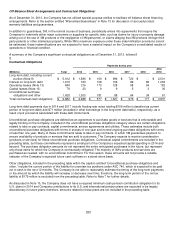
2013 because interest rates are currently very low and are projected to remain low, based on forward rates. The following
table summarizes the possible adverse and positive impacts to after-tax earnings related to these exposures.
Adverse impact on after
-
tax
earnings
Positive impact on after
-
tax
earnings
(Millions)
2013
2012
2013
2012
Foreign exchange rates
$
(111)
$
(97)
$
119
$
105
Interest rates
(2)
(2)
1
1
Commodity prices
(2)
(9)
3
7
In addition to the possible adverse and positive impacts discussed in the preceding table related to foreign exchange
rates, recent historical information is as follows. 3M estimates that year-on-year currency effects, including hedging
impacts, had the following effects on net income attributable to 3M: 2013 ($74 million decrease) and 2012 ($103 million
decrease). This estimate includes the effect of translating profits from local currencies into U.S. dollars; the impact of
currency fluctuations on the transfer of goods between 3M operations in the United States and abroad; and transaction
gains and losses, including derivative instruments designed to reduce foreign currency exchange rate risks and the
negative impact of swapping Venezuelan bolivars into U.S. dollars. 3M estimates that year-on-year derivative and other
transaction gains and losses had the following effects on net income attributable to 3M: 2013 ($12 million decrease) and
2012 ($49 million increase).
An analysis of the global exposures related to purchased components and materials is performed at each year-end. A one
percent price change would result in a pre-tax cost or savings of approximately $76 million per year. The global energy
exposure is such that a 10 percent price change would result in a pre-tax cost or savings of approximately $45 million per
year.