3M 2013 Annual Report Download - page 54
Download and view the complete annual report
Please find page 54 of the 2013 3M annual report below. You can navigate through the pages in the report by either clicking on the pages listed below, or by using the keyword search tool below to find specific information within the annual report.-
 1
1 -
2
-
3
-
4
-
5
-
6
-
7
-
8
-
9
-
10
-
11
-
12
-
13
-
14
-
15
-
16
-
17
-
18
-
19
-
20
-
21
-
22
-
23
-
24
-
25
-
26
-
27
-
28
-
29
-
30
-
31
-
32
-
33
-
34
-
35
-
36
-
37
-
38
-
39
-
40
-
41
-
42
-
43
-
 44
44 -
 45
45 -
 46
46 -
 47
47 -
 48
48 -
 49
49 -
 50
50 -
 51
51 -
 52
52 -
 53
53 -
 54
54 -
 55
55 -
 56
56 -
 57
57 -
 58
58 -
 59
59 -
 60
60 -
 61
61 -
 62
62 -
 63
63 -
 64
64 -
65
-
66
-
67
-
68
-
69
-
70
-
71
-
72
-
73
-
74
-
75
-
76
-
77
-
78
-
79
-
80
-
81
-
82
-
83
-
84
-
85
-
86
-
87
-
88
-
89
-
90
-
91
-
92
-
93
-
94
-
95
-
96
-
97
-
98
-
99
-
100
-
101
-
102
-
103
-
104
-
105
-
106
-
107
-
108
-
109
-
110
-
111
-
112
-
113
-
114
-
115
-
116
-
117
-
118
-
119
-
120
-
121
-
122
-
123
-
124
-
125
-
126
-
127
-
128
-
129
-
130
-
131
-
132
 |
 |

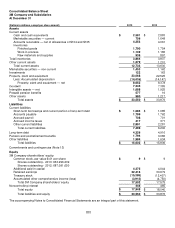
48
Consolidated Balance Sheet
3M Company and Subsidiaries
At December 31
(Dollars in millions, except per share amount) 2013 2012
Asset
s
Current assets
Cash and cash equivalents
$
2,581
$
2,883
Marketable securities — current
756
1,648
Accounts receivable — net of allowances of $104 and $105
4,253
4,061
Inventories
Finished goods
1,790
1,754
Work in process
1,139
1,186
Raw materials and supplies
935
897
Total inventories
3,864
3,837
Other current assets
1,279
1,201
Total current assets
12,733
13,630
Marketable securities — non-current
1,453
1,162
Investments
122
163
Property, plant and equipment
23,068
22,525
Less: Accumulated depreciation
(14,416)
(14,147)
Property, plant and equipment — net
8,652
8,378
Goodwill
7,345
7,385
Intangible assets — net
1,688
1,925
Prepaid pension benefits
577
16
Other assets
980
1,217
Total assets
$
33,550
$
33,876
Liabilities
Current liabilities
Short-term borrowings and current portion of long-term debt
$
1,683
$
1,085
Accounts payable
1,799
1,762
Accrued payroll
708
701
Accrued income taxes
417
371
Other current liabilities
2,891
2,281
Total current liabilities
7,498
6,200
Long-term debt
4,326
4,916
Pension and postretirement benefits
1,794
3,086
Other liabilities
1,984
1,634
Total liabilities
$
15,602
$
15,836
Commitments and contingencies (Note 13)
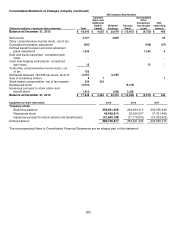
Equity
3M Company shareholders’ equity:
Common stock, par value $.01 per share
$
9
$
9
Shares outstanding - 2013: 663,296,239
Shares outstanding - 2012: 687,091,650
Additional paid-in capital
4,375
4,044
Retained earnings
32,416
30,679
Treasury stock
(15,385)
(12,407)
Accumulated other comprehensive income (loss)
(3,913)
(4,750)
Total 3M Company shareholders’ equity
17,502
17,575
Noncontrolling interest
446
465
Total equity
$
17,948
$
18,040
Total liabilities and equity
$
33,550
$
33,876
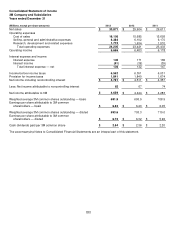
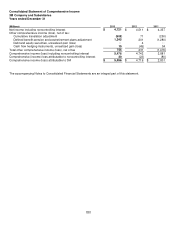
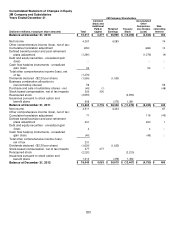
The accompanying Notes to Consolidated Financial Statements are an integral part of this statement.