Singapore Airlines 2013 Annual Report Download - page 103
Download and view the complete annual report
Please find page 103 of the 2013 Singapore Airlines annual report below. You can navigate through the pages in the report by either clicking on the pages listed below, or by using the keyword search tool below to find specific information within the annual report.-
 1
1 -
2
-
3
-
4
-
5
-
6
-
7
-
8
-
9
-
10
-
11
-
12
-
13
-
14
-
15
-
16
-
17
-
18
-
19
-
20
-
21
-
22
-
23
-
24
-
25
-
26
-
27
-
28
-
29
-
30
-
31
-
32
-
33
-
34
-
35
-
36
-
37
-
38
-
39
-
40
-
41
-
42
-
43
-
44
-
45
-
46
-
47
-
48
-
49
-
50
-
51
-
52
-
53
-
54
-
55
-
56
-
57
-
58
-
59
-
60
-
61
-
62
-
63
-
64
-
65
-
66
-
67
-
68
-
69
-
70
-
71
-
72
-
73
-
74
-
75
-
76
-
77
-
78
-
79
-
80
-
81
-
82
-
83
-
84
-
85
-
86
-
87
-
88
-
89
-
90
-
91
-
92
-
 93
93 -
 94
94 -
 95
95 -
 96
96 -
 97
97 -
 98
98 -
 99
99 -
 100
100 -
 101
101 -
 102
102 -
 103
103 -
 104
104 -
 105
105 -
 106
106 -
 107
107 -
 108
108 -
 109
109 -
 110
110 -
 111
111 -
 112
112 -
 113
113 -
114
-
115
-
116
-
117
-
118
-
119
-
120
-
121
-
122
-
123
-
124
-
125
-
126
-
127
-
128
-
129
-
130
-
131
-
132
-
133
-
134
-
135
-
136
-
137
-
138
-
139
-
140
-
141
-
142
-
143
-
144
-
145
-
146
-
147
-
148
-
149
-
150
-
151
-
152
-
153
-
154
-
155
-
156
-
157
-
158
-
159
-
160
-
161
-
162
-
163
-
164
-
165
-
166
-
167
-
168
-
169
-
170
-
171
-
172
-
173
-
174
-
175
-
176
-
177
-
178
-
179
-
180
-
181
-
182
-
183
-
184
-
185
-
186
-
187
-
188
-
189
-
190
-
191
-
192
-
193
-
194
-
195
-
196
-
197
-
198
-
199
-
200
-
201
-
202
-
203
-
204
-
205
-
206
-
207
-
208
-
209
-
210
 |
 |
101
ANNUAL REPORT 2012/13
The Group
Notes 2012-13 2011-12
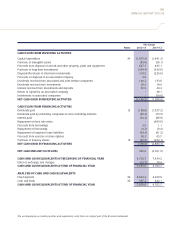
CASH FLOW FROM INVESTING ACTIVITIES
Capital expenditure 34 (1,875.4) (1,641.2)
Purchase of intangible assets (83.6) (56.1)
Proceeds from disposal of aircraft and other property, plant and equipment 647.7 495.1
Purchase of long-term investments (364.4) (339.0)
Disposal/(Purchase) of short-term investments 310.5 (229.6)
Proceeds on disposal of an associated company 4.6 -
Dividends received from associated and joint venture companies 140.2 133.6
Dividends received from investments 28.3 18.9
Interest received from investments and deposits 45.9 44.4
Return of capital by an associated company - 48.1
Investments in associated companies - (54.6)
NET CASH USED IN INVESTING ACTIVITIES (1,146.2) (1,580.4)
CASH FLOW FROM FINANCING ACTIVITIES
Dividends paid 13 (188.0) (1,557.2)
Dividends paid by subsidiary companies to non-controlling interests (56.4) (73.3)
Interest paid (34.2) (86.9)
Repayment of fixed rate notes - (900.0)
Proceeds from borrowings 3.5 1.1
Repayment of borrowings (0.2) (0.4)
Repayment of long-term lease liabilities (63.9) (61.2)
Proceeds from exercise of share options 38.3 65.7
Purchase of treasury shares 15 (37.7) (272.1)
NET CASH USED IN FINANCING ACTIVITIES (338.6) (2,884.3)
NET CASH INFLOW/(OUTFLOW) 369.6 (2,761.9)
CASH AND CASH EQUIVALENTS AT BEGINNING OF FINANCIAL YEAR 4,702.7 7,434.2
Effect of exchange rate changes (12.7) 30.4
CASH AND CASH EQUIVALENTS AT END OF FINANCIAL YEAR 5,059.6 4,702.7
ANALYSIS OF CASH AND CASH EQUIVALENTS
Fixed deposits 32 4,692.4 4,260.6
Cash and bank 32 367.2 442.1
CASH AND CASH EQUIVALENTS AT END OF FINANCIAL YEAR 5,059.6 4,702.7
The accompanying accounting policies and explanatory notes form an integral part of the financial statements.