Singapore Airlines 2013 Annual Report Download - page 141
Download and view the complete annual report
Please find page 141 of the 2013 Singapore Airlines annual report below. You can navigate through the pages in the report by either clicking on the pages listed below, or by using the keyword search tool below to find specific information within the annual report.-
 1
1 -
2
-
3
-
4
-
5
-
6
-
7
-
8
-
9
-
10
-
11
-
12
-
13
-
14
-
15
-
16
-
17
-
18
-
19
-
20
-
21
-
22
-
23
-
24
-
25
-
26
-
27
-
28
-
29
-
30
-
31
-
32
-
33
-
34
-
35
-
36
-
37
-
38
-
39
-
40
-
41
-
42
-
43
-
44
-
45
-
46
-
47
-
48
-
49
-
50
-
51
-
52
-
53
-
54
-
55
-
56
-
57
-
58
-
59
-
60
-
61
-
62
-
63
-
64
-
65
-
66
-
67
-
68
-
69
-
70
-
71
-
72
-
73
-
74
-
75
-
76
-
77
-
78
-
79
-
80
-
81
-
82
-
83
-
84
-
85
-
86
-
87
-
88
-
89
-
90
-
91
-
92
-
93
-
94
-
95
-
96
-
97
-
98
-
99
-
100
-
101
-
102
-
103
-
104
-
105
-
106
-
107
-
108
-
109
-
110
-
111
-
112
-
113
-
114
-
115
-
116
-
117
-
118
-
119
-
120
-
121
-
122
-
123
-
124
-
125
-
126
-
127
-
128
-
129
-
130
-
 131
131 -
 132
132 -
 133
133 -
 134
134 -
 135
135 -
 136
136 -
 137
137 -
 138
138 -
 139
139 -
 140
140 -
 141
141 -
 142
142 -
 143
143 -
 144
144 -
 145
145 -
 146
146 -
 147
147 -
 148
148 -
 149
149 -
 150
150 -
 151
151 -
152
-
153
-
154
-
155
-
156
-
157
-
158
-
159
-
160
-
161
-
162
-
163
-
164
-
165
-
166
-
167
-
168
-
169
-
170
-
171
-
172
-
173
-
174
-
175
-
176
-
177
-
178
-
179
-
180
-
181
-
182
-
183
-
184
-
185
-
186
-
187
-
188
-
189
-
190
-
191
-
192
-
193
-
194
-
195
-
196
-
197
-
198
-
199
-
200
-
201
-
202
-
203
-
204
-
205
-
206
-
207
-
208
-
209
-
210
 |
 |
139
ANNUAL REPORT 2012/13
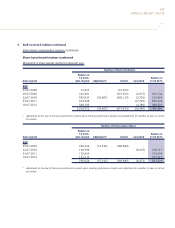
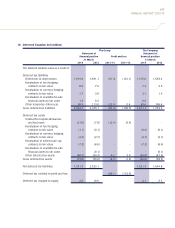
5 Staff Costs (in $ million) (continued)
Share-based compensation expense (continued)
Share-based incentive plans (continued)
Fair value of share awards granted (continued)
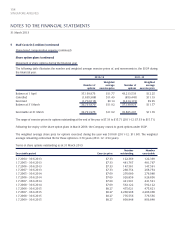
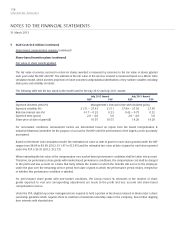
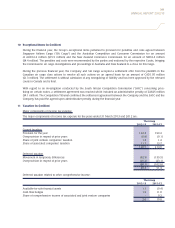
The number of contingent shares granted but not released as at 31 March 2013, were 1,460,384 (2012: 1,434,249) and
491,329 (2012: 523,811) for RSP and PSP respectively. Based on the achievement factor, the actual release of the awards
could range from zero to a maximum of 2,028,315 (2012: 1,994,397) and 982,658 (2012: 1,047,622) fully-paid ordinary
shares of the Company, for RSP and PSP respectively.
Details and terms of the SIAEC RSP and SIAEC PSP have been disclosed in the Annual Report of SIAEC.
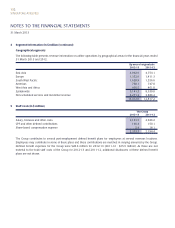
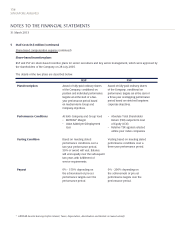
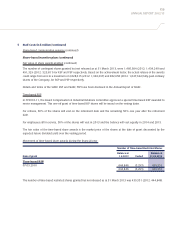
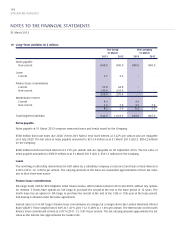
Time-based RSP
In FY2010-11, the Board Compensation & Industrial Relations Committee approved a special time-based RSP awarded to
senior management. This one-off grant of time-based RSP shares will be issued on the vesting dates.
For retirees, 50% of the shares will vest on the retirement date and the remaining 50% one year after the retirement
date.
For employees still in service, 50% of the shares will vest in 2013 and the balance will vest equally in 2014 and 2015.
The fair value of the time-based share awards is the market price of the shares at the date of grant discounted by the
expected future dividend yield over the vesting period.
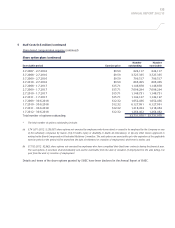
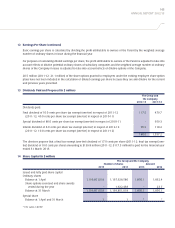
Movement of time-based share awards during the financial year
Number of Time-based Restricted Shares
Balance at Balance at
Date of grant 1.4.2012 Vested 31.03.2013
Time-based RSP
07.05.2010 444,846 (5,295) 439,551
444,846 (5,295) 439,551
The number of time-based restricted shares granted but not released as at 31 March 2013 was 439,551 (2012: 444,846).