Singapore Airlines 2013 Annual Report Download - page 74
Download and view the complete annual report
Please find page 74 of the 2013 Singapore Airlines annual report below. You can navigate through the pages in the report by either clicking on the pages listed below, or by using the keyword search tool below to find specific information within the annual report.-
 1
1 -
2
-
3
-
4
-
5
-
6
-
7
-
8
-
9
-
10
-
11
-
12
-
13
-
14
-
15
-
16
-
17
-
18
-
19
-
20
-
21
-
22
-
23
-
24
-
25
-
26
-
27
-
28
-
29
-
30
-
31
-
32
-
33
-
34
-
35
-
36
-
37
-
38
-
39
-
40
-
41
-
42
-
43
-
44
-
45
-
46
-
47
-
48
-
49
-
50
-
51
-
52
-
53
-
54
-
55
-
56
-
57
-
58
-
59
-
60
-
61
-
62
-
63
-
 64
64 -
 65
65 -
 66
66 -
 67
67 -
 68
68 -
 69
69 -
 70
70 -
 71
71 -
 72
72 -
 73
73 -
 74
74 -
 75
75 -
 76
76 -
 77
77 -
 78
78 -
 79
79 -
 80
80 -
 81
81 -
 82
82 -
 83
83 -
 84
84 -
85
-
86
-
87
-
88
-
89
-
90
-
91
-
92
-
93
-
94
-
95
-
96
-
97
-
98
-
99
-
100
-
101
-
102
-
103
-
104
-
105
-
106
-
107
-
108
-
109
-
110
-
111
-
112
-
113
-
114
-
115
-
116
-
117
-
118
-
119
-
120
-
121
-
122
-
123
-
124
-
125
-
126
-
127
-
128
-
129
-
130
-
131
-
132
-
133
-
134
-
135
-
136
-
137
-
138
-
139
-
140
-
141
-
142
-
143
-
144
-
145
-
146
-
147
-
148
-
149
-
150
-
151
-
152
-
153
-
154
-
155
-
156
-
157
-
158
-
159
-
160
-
161
-
162
-
163
-
164
-
165
-
166
-
167
-
168
-
169
-
170
-
171
-
172
-
173
-
174
-
175
-
176
-
177
-
178
-
179
-
180
-
181
-
182
-
183
-
184
-
185
-
186
-
187
-
188
-
189
-
190
-
191
-
192
-
193
-
194
-
195
-
196
-
197
-
198
-
199
-
200
-
201
-
202
-
203
-
204
-
205
-
206
-
207
-
208
-
209
-
210
 |
 |
072
SINGAPORE AIRLINES
FINANCIAL REVIEW
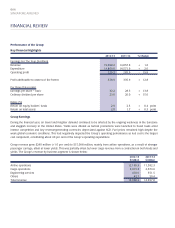
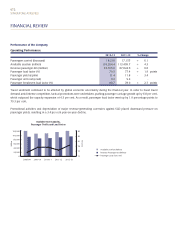
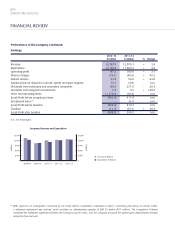
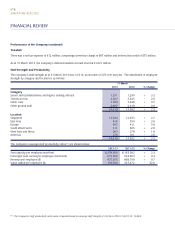
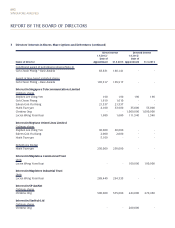
Performance of the Company
Operating Performance
2012-13 2011-12 % Change
Passengers carried (thousand) 18,210 17,155 + 6.1
Available seat-km (million) 118,264.4 113,409.7 + 4.3
Revenue passenger-km (million) 93,765.6 87,824.0 + 6.8
Passenger load factor (%) 79.3 77.4 + 1.9 points
Passenger yield (¢/pkm) 11.4 11.8 - 3.4
Passenger unit cost (¢/ask) 9.2 9.2 -
Passenger breakeven load factor (%) 80.7 78.0 + 2.7 points
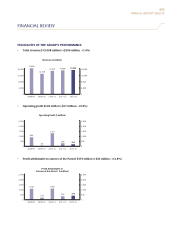
Travel sentiment continued to be affected by global economic uncertainty during the financial year. In order to boost travel
demand amid intense competition, tactical promotions were undertaken, pushing passenger carriage growth up by 6.8 per cent,
which outpaced the capacity expansion of 4.3 per cent. As a result, passenger load factor went up by 1.9 percentage points to
79.3 per cent.
Promotional activities and depreciation of major revenue-generating currencies against SGD placed downward pressure on
passenger yields, resulting in a 3.4 per cent year-on-year decline.
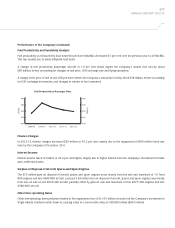
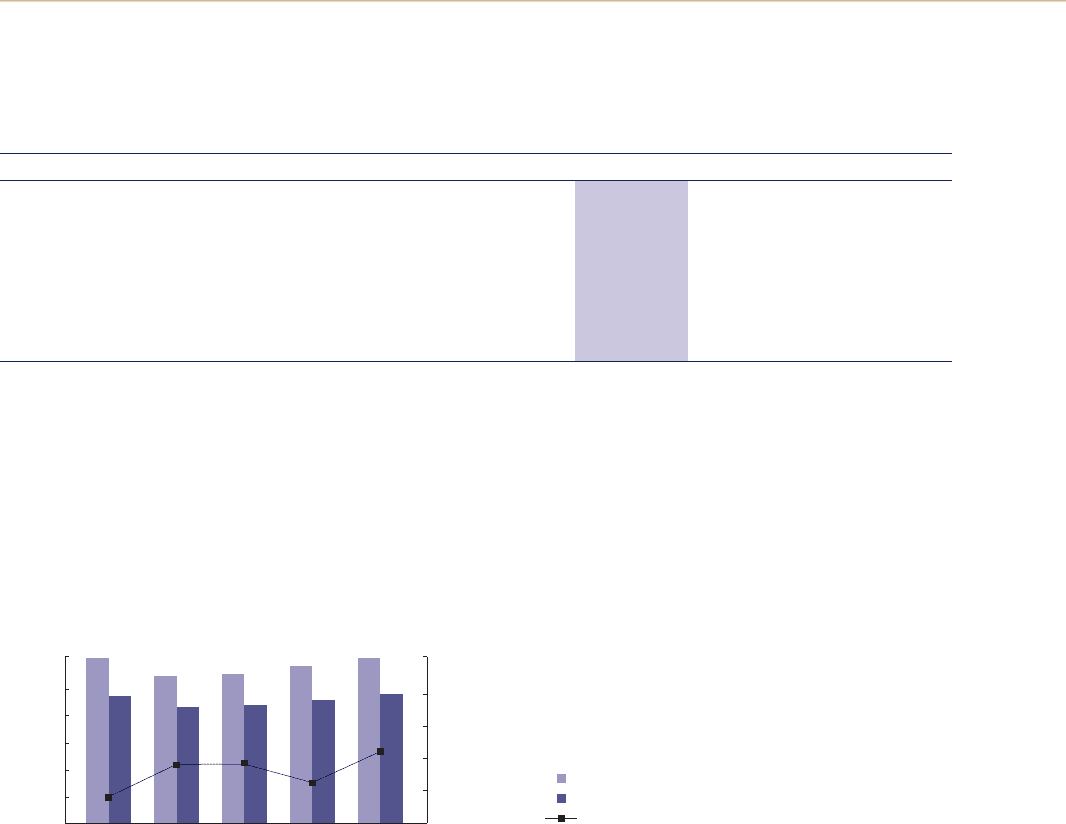
Available Seat Capacity,
Passenger Traffic and Load Factor
Million
120,000
80,000
100,000
60,000
40,000
20,000
0
Per Cent
81
79
77
85
83
75
Available Seat-km (Million)
Revenue Passenger-km (Million)
Passenger Load Factor (%)
2008-09 2009-10 2010-11 2011-12 2012-13