Singapore Airlines 2013 Annual Report Download - page 134
Download and view the complete annual report
Please find page 134 of the 2013 Singapore Airlines annual report below. You can navigate through the pages in the report by either clicking on the pages listed below, or by using the keyword search tool below to find specific information within the annual report.-
 1
1 -
2
-
3
-
4
-
5
-
6
-
7
-
8
-
9
-
10
-
11
-
12
-
13
-
14
-
15
-
16
-
17
-
18
-
19
-
20
-
21
-
22
-
23
-
24
-
25
-
26
-
27
-
28
-
29
-
30
-
31
-
32
-
33
-
34
-
35
-
36
-
37
-
38
-
39
-
40
-
41
-
42
-
43
-
44
-
45
-
46
-
47
-
48
-
49
-
50
-
51
-
52
-
53
-
54
-
55
-
56
-
57
-
58
-
59
-
60
-
61
-
62
-
63
-
64
-
65
-
66
-
67
-
68
-
69
-
70
-
71
-
72
-
73
-
74
-
75
-
76
-
77
-
78
-
79
-
80
-
81
-
82
-
83
-
84
-
85
-
86
-
87
-
88
-
89
-
90
-
91
-
92
-
93
-
94
-
95
-
96
-
97
-
98
-
99
-
100
-
101
-
102
-
103
-
104
-
105
-
106
-
107
-
108
-
109
-
110
-
111
-
112
-
113
-
114
-
115
-
116
-
117
-
118
-
119
-
120
-
121
-
122
-
123
-
 124
124 -
 125
125 -
 126
126 -
 127
127 -
 128
128 -
 129
129 -
 130
130 -
 131
131 -
 132
132 -
 133
133 -
 134
134 -
 135
135 -
 136
136 -
 137
137 -
 138
138 -
 139
139 -
 140
140 -
 141
141 -
 142
142 -
 143
143 -
 144
144 -
145
-
146
-
147
-
148
-
149
-
150
-
151
-
152
-
153
-
154
-
155
-
156
-
157
-
158
-
159
-
160
-
161
-
162
-
163
-
164
-
165
-
166
-
167
-
168
-
169
-
170
-
171
-
172
-
173
-
174
-
175
-
176
-
177
-
178
-
179
-
180
-
181
-
182
-
183
-
184
-
185
-
186
-
187
-
188
-
189
-
190
-
191
-
192
-
193
-
194
-
195
-
196
-
197
-
198
-
199
-
200
-
201
-
202
-
203
-
204
-
205
-
206
-
207
-
208
-
209
-
210
 |
 |

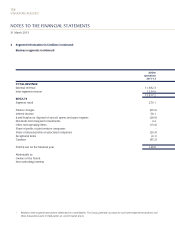
132
SINGAPORE AIRLINES
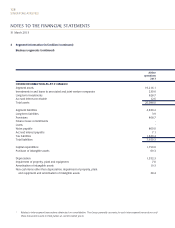
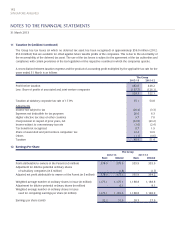
NOTES TO THE FINANCIAL STATEMENTS
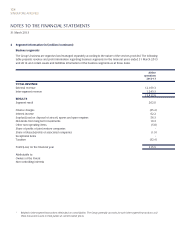
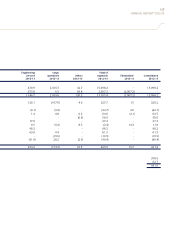
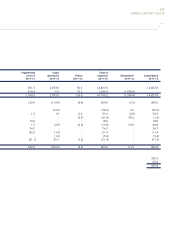
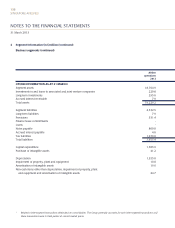
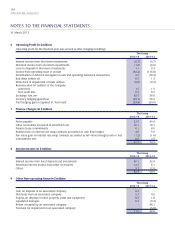
4 Segment Information (in $ million) (continued)
Geographical segments
The following table presents revenue information on airline operations by geographical areas for the financial years ended
31 March 2013 and 2012.
By area of original sale
2012-13 2011-12
East Asia 4,962.9 4,754.1
Europe 1,352.9 1,411.3
South West Pacific 1,628.9 1,556.6
Americas 760.1 747.8
West Asia and Africa 436.5 461.0
Systemwide 9,141.3 8,930.8
Non-scheduled services and incidental revenue 4,271.3 3,886.4
13,412.6 12,817.2
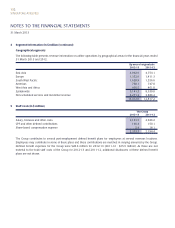
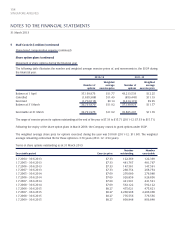
5 Staff Costs (in $ million)
The Group
2012-13 2011-12
Salary, bonuses and other costs 2,181.5 2,026.2
CPF and other defined contributions 166.4 150.1
Share-based compensation expense 5.4 18.1
2,353.3 2,194.4
The Group contributes to several post-employment defined benefit plans for employees at several overseas locations.
Employees may contribute in some of these plans and these contributions are matched in varying amounts by the Group.
Defined benefit expenses for the Group were $28.6 million for 2012-13 (2011-12 : $25.9 million). As these are not
material to the total staff costs of the Group for 2012-13 and 2011-12, additional disclosures of these defined benefit
plans are not shown.
31 March 2013