Singapore Airlines 2013 Annual Report Download - page 67
Download and view the complete annual report
Please find page 67 of the 2013 Singapore Airlines annual report below. You can navigate through the pages in the report by either clicking on the pages listed below, or by using the keyword search tool below to find specific information within the annual report.-
 1
1 -
2
-
3
-
4
-
5
-
6
-
7
-
8
-
9
-
10
-
11
-
12
-
13
-
14
-
15
-
16
-
17
-
18
-
19
-
20
-
21
-
22
-
23
-
24
-
25
-
26
-
27
-
28
-
29
-
30
-
31
-
32
-
33
-
34
-
35
-
36
-
37
-
38
-
39
-
40
-
41
-
42
-
43
-
44
-
45
-
46
-
47
-
48
-
49
-
50
-
51
-
52
-
53
-
54
-
55
-
56
-
 57
57 -
 58
58 -
 59
59 -
 60
60 -
 61
61 -
 62
62 -
 63
63 -
 64
64 -
 65
65 -
 66
66 -
 67
67 -
 68
68 -
 69
69 -
 70
70 -
 71
71 -
 72
72 -
 73
73 -
 74
74 -
 75
75 -
 76
76 -
 77
77 -
78
-
79
-
80
-
81
-
82
-
83
-
84
-
85
-
86
-
87
-
88
-
89
-
90
-
91
-
92
-
93
-
94
-
95
-
96
-
97
-
98
-
99
-
100
-
101
-
102
-
103
-
104
-
105
-
106
-
107
-
108
-
109
-
110
-
111
-
112
-
113
-
114
-
115
-
116
-
117
-
118
-
119
-
120
-
121
-
122
-
123
-
124
-
125
-
126
-
127
-
128
-
129
-
130
-
131
-
132
-
133
-
134
-
135
-
136
-
137
-
138
-
139
-
140
-
141
-
142
-
143
-
144
-
145
-
146
-
147
-
148
-
149
-
150
-
151
-
152
-
153
-
154
-
155
-
156
-
157
-
158
-
159
-
160
-
161
-
162
-
163
-
164
-
165
-
166
-
167
-
168
-
169
-
170
-
171
-
172
-
173
-
174
-
175
-
176
-
177
-
178
-
179
-
180
-
181
-
182
-
183
-
184
-
185
-
186
-
187
-
188
-
189
-
190
-
191
-
192
-
193
-
194
-
195
-
196
-
197
-
198
-
199
-
200
-
201
-
202
-
203
-
204
-
205
-
206
-
207
-
208
-
209
-
210
 |
 |
065
ANNUAL REPORT 2012/13
216
1,092
336 379
1,062
63
1,271
286 229
904
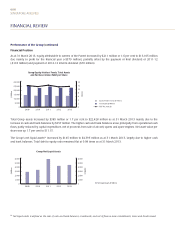
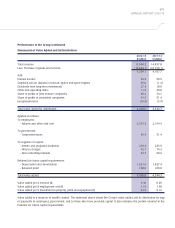
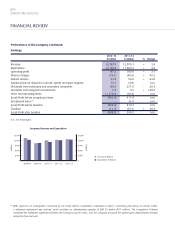
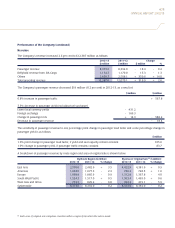
FINANCIAL REVIEW
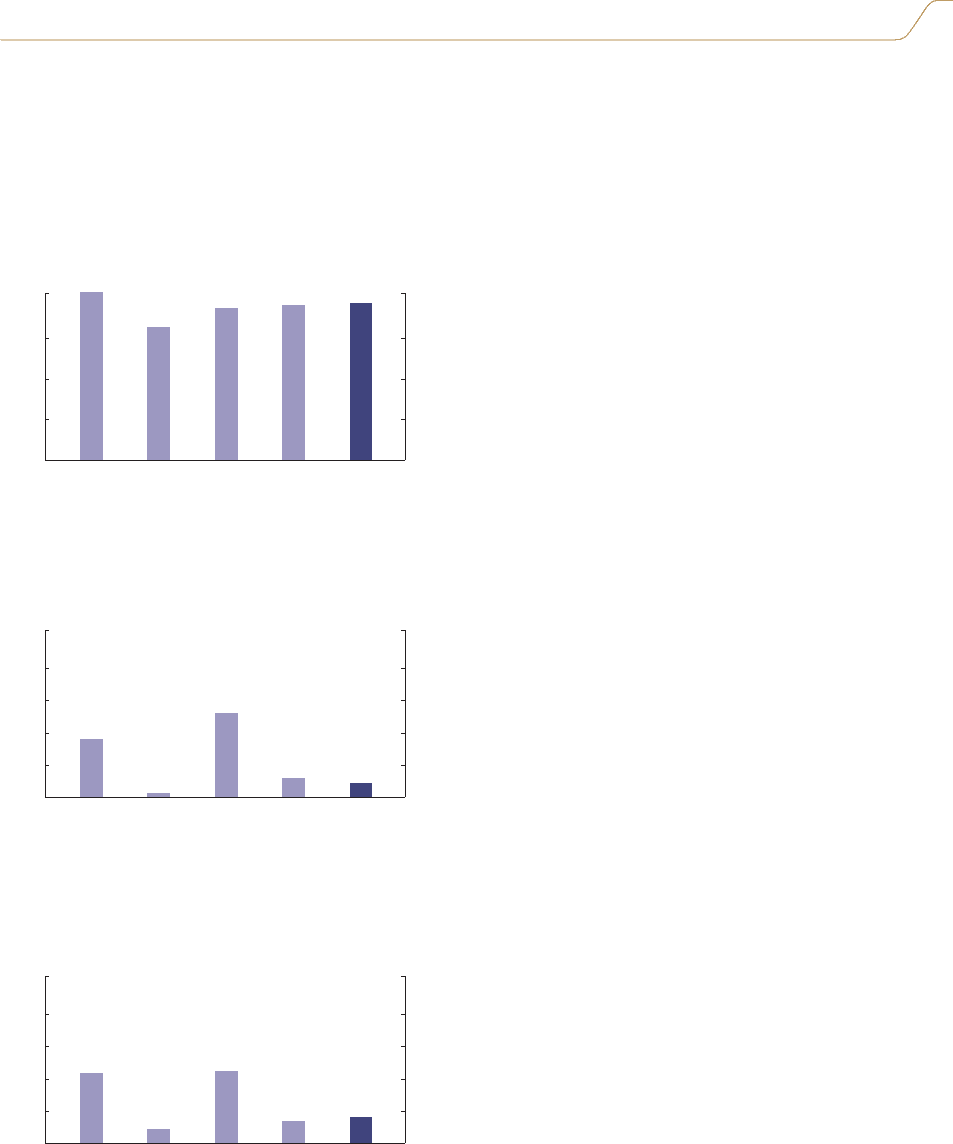
16,000 16,000
12,708
14,525 14,858 15,098
15,996
12,000 12,000
8,000 8,000
4,000 4,000
0 0
2008-09 2009-10 2010-11 2011-12 2012-13
Revenue ($ million)
2,500 2,500
1,500 1,500
2,000 2,000
1,000 1,000
500 500
0 0
2008-09 2009-10 2010-11 2011-12 2012-13
2008-09 2009-10 2010-11 2011-12 2012-13
2,500 2,500
1,500 1,500
2,000 2,000
1,000 1,000
500 500
0 0
Operating Profit ($ million)
Profit Attributable to
Owners of the Parent ($ million)
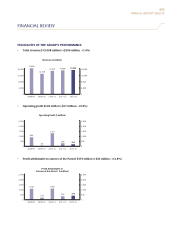
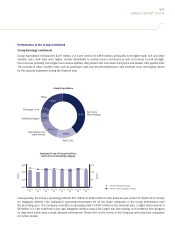
HIGHLIGHTS OF THE GROUP’S PERFORMANCE
• Total revenue $15,098 million (+$240 million, +1.6%)
• Operating profit $229 million (-$57 million, -19.8%)
• Profit attributable to owners of the Parent $379 million (+$43 million, +12.8%)