Singapore Airlines 2013 Annual Report Download - page 73
Download and view the complete annual report
Please find page 73 of the 2013 Singapore Airlines annual report below. You can navigate through the pages in the report by either clicking on the pages listed below, or by using the keyword search tool below to find specific information within the annual report.-
 1
1 -
2
-
3
-
4
-
5
-
6
-
7
-
8
-
9
-
10
-
11
-
12
-
13
-
14
-
15
-
16
-
17
-
18
-
19
-
20
-
21
-
22
-
23
-
24
-
25
-
26
-
27
-
28
-
29
-
30
-
31
-
32
-
33
-
34
-
35
-
36
-
37
-
38
-
39
-
40
-
41
-
42
-
43
-
44
-
45
-
46
-
47
-
48
-
49
-
50
-
51
-
52
-
53
-
54
-
55
-
56
-
57
-
58
-
59
-
60
-
61
-
62
-
 63
63 -
 64
64 -
 65
65 -
 66
66 -
 67
67 -
 68
68 -
 69
69 -
 70
70 -
 71
71 -
 72
72 -
 73
73 -
 74
74 -
 75
75 -
 76
76 -
 77
77 -
 78
78 -
 79
79 -
 80
80 -
 81
81 -
 82
82 -
 83
83 -
84
-
85
-
86
-
87
-
88
-
89
-
90
-
91
-
92
-
93
-
94
-
95
-
96
-
97
-
98
-
99
-
100
-
101
-
102
-
103
-
104
-
105
-
106
-
107
-
108
-
109
-
110
-
111
-
112
-
113
-
114
-
115
-
116
-
117
-
118
-
119
-
120
-
121
-
122
-
123
-
124
-
125
-
126
-
127
-
128
-
129
-
130
-
131
-
132
-
133
-
134
-
135
-
136
-
137
-
138
-
139
-
140
-
141
-
142
-
143
-
144
-
145
-
146
-
147
-
148
-
149
-
150
-
151
-
152
-
153
-
154
-
155
-
156
-
157
-
158
-
159
-
160
-
161
-
162
-
163
-
164
-
165
-
166
-
167
-
168
-
169
-
170
-
171
-
172
-
173
-
174
-
175
-
176
-
177
-
178
-
179
-
180
-
181
-
182
-
183
-
184
-
185
-
186
-
187
-
188
-
189
-
190
-
191
-
192
-
193
-
194
-
195
-
196
-
197
-
198
-
199
-
200
-
201
-
202
-
203
-
204
-
205
-
206
-
207
-
208
-
209
-
210
 |
 |
071
ANNUAL REPORT 2012/13
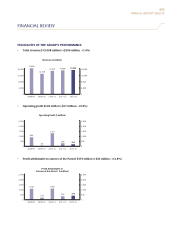
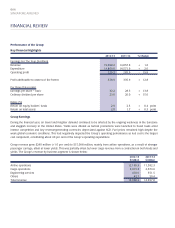
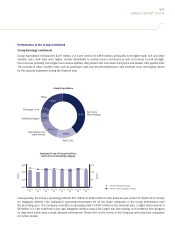
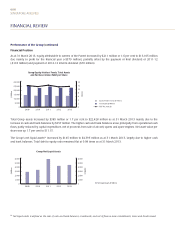
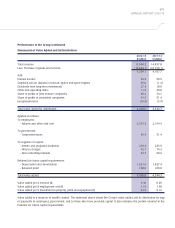
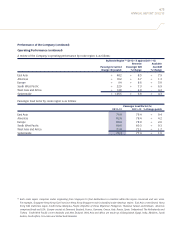
Performance of the Group (continued)
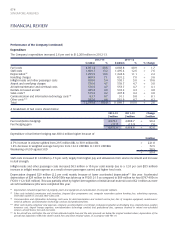
Statements of Value Added and its Distribution
2012-13 2011-12
$ million $ million
Total revenue 15,098.2 14,857.8
Less: Purchase of goods and services (10,894.1) (10,750.1)
4,204.1 4,107.7
Add:
Interest income 62.5 50.5
Surplus/(Loss) on disposal of aircraft, spares and spare engines 56.0 (1.4)
Dividends from long-term investments 27.3 18.0
Other non-operating items 11.9 48.8
Share of profits of joint venture companies 96.2 74.7
Share of profits of associated companies 61.5 51.4
Exceptional items (19.9) (5.4)
Total value added for distribution 4,499.6 4,344.3
Applied as follows:
To employees:
- Salaries and other staff cost 2,353.3 2,194.4
To government:
- Corporation taxes 40.4 51.4
To suppliers of capital:
- Interim and proposed dividends 270.3 235.9
- Finance charges 42.7 74.3
- Non-controlling interests 62.7 60.9
Retained for future capital requirements:
- Depreciation and amortisation 1,621.6 1,627.4
- Retained profit 108.6 100.0
Total value added 4,499.6 4,344.3
Value added per $ revenue ($) 0.30 0.29
Value added per $ employment cost ($) 1.91 1.98
Value added per $ investment in property, plant and equipment ($) 0.19 0.19
Value added is a measure of wealth created. The statement above shows the Group’s value added and its distribution by way
of payments to employees, government, and to those who have provided capital. It also indicates the portion retained in the
business for future capital requirements.