Singapore Airlines 2013 Annual Report Download - page 80
Download and view the complete annual report
Please find page 80 of the 2013 Singapore Airlines annual report below. You can navigate through the pages in the report by either clicking on the pages listed below, or by using the keyword search tool below to find specific information within the annual report.-
 1
1 -
2
-
3
-
4
-
5
-
6
-
7
-
8
-
9
-
10
-
11
-
12
-
13
-
14
-
15
-
16
-
17
-
18
-
19
-
20
-
21
-
22
-
23
-
24
-
25
-
26
-
27
-
28
-
29
-
30
-
31
-
32
-
33
-
34
-
35
-
36
-
37
-
38
-
39
-
40
-
41
-
42
-
43
-
44
-
45
-
46
-
47
-
48
-
49
-
50
-
51
-
52
-
53
-
54
-
55
-
56
-
57
-
58
-
59
-
60
-
61
-
62
-
63
-
64
-
65
-
66
-
67
-
68
-
69
-
 70
70 -
 71
71 -
 72
72 -
 73
73 -
 74
74 -
 75
75 -
 76
76 -
 77
77 -
 78
78 -
 79
79 -
 80
80 -
 81
81 -
 82
82 -
 83
83 -
 84
84 -
 85
85 -
 86
86 -
 87
87 -
 88
88 -
 89
89 -
 90
90 -
91
-
92
-
93
-
94
-
95
-
96
-
97
-
98
-
99
-
100
-
101
-
102
-
103
-
104
-
105
-
106
-
107
-
108
-
109
-
110
-
111
-
112
-
113
-
114
-
115
-
116
-
117
-
118
-
119
-
120
-
121
-
122
-
123
-
124
-
125
-
126
-
127
-
128
-
129
-
130
-
131
-
132
-
133
-
134
-
135
-
136
-
137
-
138
-
139
-
140
-
141
-
142
-
143
-
144
-
145
-
146
-
147
-
148
-
149
-
150
-
151
-
152
-
153
-
154
-
155
-
156
-
157
-
158
-
159
-
160
-
161
-
162
-
163
-
164
-
165
-
166
-
167
-
168
-
169
-
170
-
171
-
172
-
173
-
174
-
175
-
176
-
177
-
178
-
179
-
180
-
181
-
182
-
183
-
184
-
185
-
186
-
187
-
188
-
189
-
190
-
191
-
192
-
193
-
194
-
195
-
196
-
197
-
198
-
199
-
200
-
201
-
202
-
203
-
204
-
205
-
206
-
207
-
208
-
209
-
210
 |
 |
078
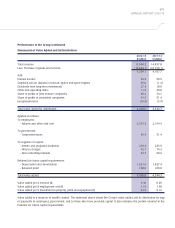
SINGAPORE AIRLINES
FINANCIAL REVIEW
Performance of the Company (continued)
Taxation
There was a net tax expense of $12 million, comprising current tax charge of $87 million and deferred tax credit of $75 million.
As at 31 March 2013, the Company’s deferred taxation account stood at $1,621 million.
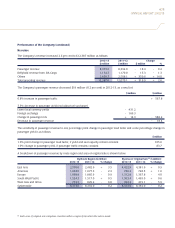
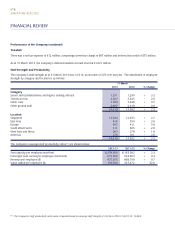
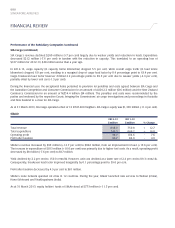
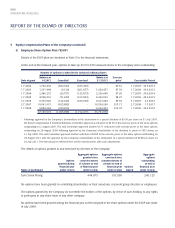
Staff Strength and Productivity
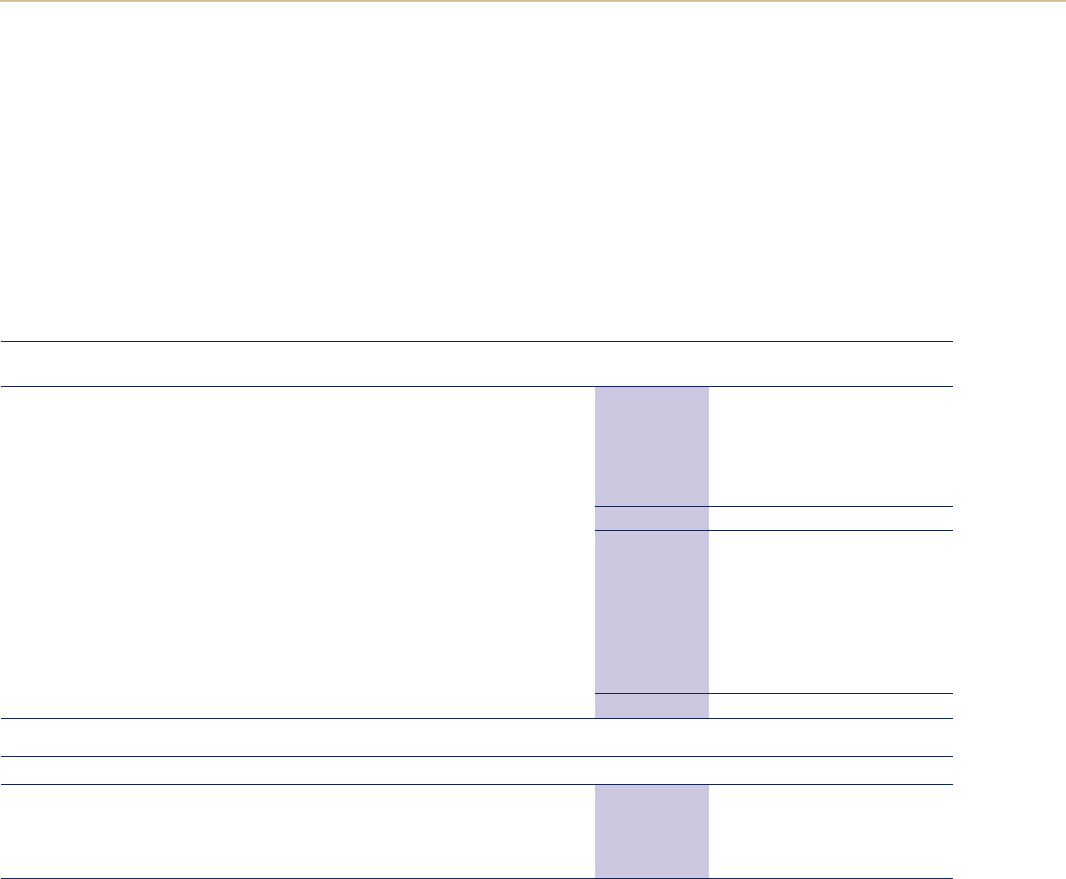
The Company’s staff strength as at 31 March 2013 was 14,319, an increase of 327 over last year. The distribution of employee
strength by category and location is as follows:
31 March
2013 2012 % Change
Category
Senior staff (administrative and higher ranking officers) 1,331 1,290 + 3.2
Technical crew 2,297 2,345 - 2.0
Cabin crew 7,784 7,438 + 4.7
Other ground staff 2,907 2,919 - 0.4
14,319 13,992 + 2.3
Location
Singapore 12,344 12,023 + 2.7
East Asia 818 794 + 3.0
Europe 387 411 - 5.8
South West Pacific 311 305 + 2.0
West Asia and Africa 283 278 + 1.8
Americas 176 181 - 2.8
14,319 13,992 + 2.3
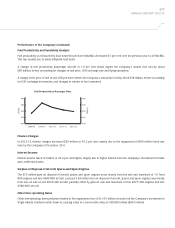
The Company’s average staff productivity ratiosR12 are shown below:
2012-13 2011-12 % Change
Seat capacity per employee (seat-km) 8,354,366 8,163,082 + 2.3
Passenger load carried per employee (tonne-km) 619,969 594,663 + 4.3
Revenue per employee ($) 875,035 868,790 + 0.7
Value added per employee ($) 159,593 237,472 - 32.8
R12 The Company’s staff productivity ratios were computed based on average staff strength of 14,156 in 2012-13 (2011-12: 13,893).