APC 2004 Annual Report Download - page 111
Download and view the complete annual report
Please find page 111 of the 2004 APC annual report below. You can navigate through the pages in the report by either clicking on the pages listed below, or by using the keyword search tool below to find specific information within the annual report.-
 1
1 -
2
-
3
-
4
-
5
-
6
-
7
-
8
-
9
-
10
-
11
-
12
-
13
-
14
-
15
-
16
-
17
-
18
-
19
-
20
-
21
-
22
-
23
-
24
-
25
-
26
-
27
-
28
-
29
-
30
-
31
-
32
-
33
-
34
-
35
-
36
-
37
-
38
-
39
-
40
-
41
-
42
-
43
-
44
-
45
-
46
-
47
-
48
-
49
-
50
-
51
-
52
-
53
-
54
-
55
-
56
-
57
-
58
-
59
-
60
-
61
-
62
-
63
-
64
-
65
-
66
-
67
-
68
-
69
-
70
-
71
-
72
-
73
-
74
-
75
-
76
-
77
-
78
-
79
-
80
-
81
-
82
-
83
-
84
-
85
-
86
-
87
-
88
-
89
-
90
-
91
-
92
-
93
-
94
-
95
-
96
-
97
-
98
-
99
-
100
-
 101
101 -
 102
102 -
 103
103 -
 104
104 -
 105
105 -
 106
106 -
 107
107 -
 108
108 -
 109
109 -
 110
110 -
 111
111 -
 112
112 -
 113
113 -
 114
114 -
 115
115 -
 116
116 -
 117
117 -
 118
118 -
 119
119 -
 120
120 -
 121
121 -
122
-
123
-
124
-
125
-
126
-
127
-
128
-
129
-
130
-
131
-
132
-
133
-
134
-
135
-
136
-
137
-
138
-
139
-
140
-
141
-
142
-
143
-
144
-
145
-
146
-
147
-
148
 |
 |

109
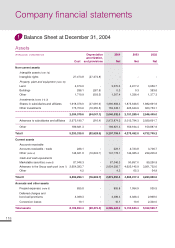
1.2 - Closing balance sheet
Assets
(in millions of euros) Notes
Dec. 31, 2004
Restate-
Dec. 31, 2004 Jan. 1, 2004
French GAAP
ments
IFRS IFRS
Non-current assets
Goodwill, net
2.3-2
4,077.7
384.6
4,462.3 3,512.8
Intangible assets
2.3-1
846.5
48.0
894.5 272.0
Property, plant and equipment
2.4-3
1,458.8
(2.1)
1,456.7 1,429.8
Assets held for sale
2.4-3 7.6
7.6 14.8
Investments
Investments accounted for by the equity method 65.3
0.0
65.3 60.5
Available for sale financial assets
2.5
154.3
0.0
154.3 369.6
Other financial assets 288.1
0.0
288.1 585.4
Total investments 507.7
0.0
507.7 1,015.5
Deferred taxes
2.3-4
752.8
77.5
830.3 923.1
Other non current assets
2.3-5
262.1
(262.1)
0.0 0.4
Total non-current assets 7,905.6
253.5
8,159.1 7,168.4
Current assets
Inventories and work in progress
2.3-3
1,369.7
39.7
1,409.4 1,160.3
Trade accounts receivable 2,135.7
0.0
2,135.7 1,749.7
Other receivables and prepaid expenses
2.3-1 ; 2.4-5
571.5
(42.4)
529.1 586.6
Cash and cash equivalents
2.5
1,062.8
0.0
1,062.8 3,087.5
Total current assets 5,139.7
(2.7)
5,137.0 6,584.1
Total assets 13,045.3
250.8
13,296.1 13,752.5
Consolidated financial statements