APC 2004 Annual Report Download - page 113
Download and view the complete annual report
Please find page 113 of the 2004 APC annual report below. You can navigate through the pages in the report by either clicking on the pages listed below, or by using the keyword search tool below to find specific information within the annual report.-
 1
1 -
2
-
3
-
4
-
5
-
6
-
7
-
8
-
9
-
10
-
11
-
12
-
13
-
14
-
15
-
16
-
17
-
18
-
19
-
20
-
21
-
22
-
23
-
24
-
25
-
26
-
27
-
28
-
29
-
30
-
31
-
32
-
33
-
34
-
35
-
36
-
37
-
38
-
39
-
40
-
41
-
42
-
43
-
44
-
45
-
46
-
47
-
48
-
49
-
50
-
51
-
52
-
53
-
54
-
55
-
56
-
57
-
58
-
59
-
60
-
61
-
62
-
63
-
64
-
65
-
66
-
67
-
68
-
69
-
70
-
71
-
72
-
73
-
74
-
75
-
76
-
77
-
78
-
79
-
80
-
81
-
82
-
83
-
84
-
85
-
86
-
87
-
88
-
89
-
90
-
91
-
92
-
93
-
94
-
95
-
96
-
97
-
98
-
99
-
100
-
101
-
102
-
 103
103 -
 104
104 -
 105
105 -
 106
106 -
 107
107 -
 108
108 -
 109
109 -
 110
110 -
 111
111 -
 112
112 -
 113
113 -
 114
114 -
 115
115 -
 116
116 -
 117
117 -
 118
118 -
 119
119 -
 120
120 -
 121
121 -
 122
122 -
 123
123 -
124
-
125
-
126
-
127
-
128
-
129
-
130
-
131
-
132
-
133
-
134
-
135
-
136
-
137
-
138
-
139
-
140
-
141
-
142
-
143
-
144
-
145
-
146
-
147
-
148
 |
 |

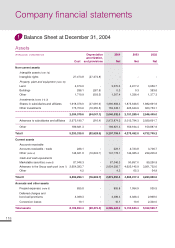
111
Consolidated Statement of Income
(in millions of euros except for earnings per share) Notes
Dec. 31, 2004
Restate-
Dec. 31, 2004
French GAAP
ments
IFRS
Sales
2.3-6
10,365.3
(16.0)
10,349.3
Cost of sales
2.3-1
(5,965.1)
(212.3)
(6,177.4)
Gross Margin 4,400.2
(228.3)
4,171.9
Research and development expenses
2.3-1
(535.2)
240.1
(295.1)
Selling, general and administrative expenses (2,554.3)
(36.1)
(2,590.4)
Operating income 1,310.7
(24.3)
1,286.4
Financial expense, net (65.9)
6.6
(59.3)
Income from continuing operations before tax 1,244.8
(17.7)
1,227.1
Exceptional items
2.2
(96.3)
96.3
0.0
Income tax (333.1)
(32.1)
(365.2)
Net income of fully consolidated companies
before amortization of goodwill 815.4
46.5
861.9
Amortization of goodwill
2.3-2
(217.1)
217.1
0.0
Group's share of income/(loss)
of equity investments (3.6) (3.6)
Net income/(loss) before minority interests 594.7
263.6
858.3
Minority interests (30.1)
(4.3)
(34.4)
Net income/(loss)
(attributable to Schneider Electric SA) 564.6
259.3
823.9
Earnings/(loss) per share (in euros)
2.2
2.56 3.73
Diluted earnings/(loss) per share (in euros)
2.2
2.55 3.72
1.3 - Consolidated Statement of Income
(in millions of euros)
Net income (attributable to Schneider Electric SA) - French GAAP - Dec. 31, 2004 564.6
IFRS restatements
Notes
Amortization of goodwill
2.3-2
217.1
Capitalization of development costs
2.3-1
45.6
Reversal of actuarial gain and loss amortization
2.3-5
38.7
Stock options expense
2.3-7
(8.9)
Others 3.2
Deferred tax impact of restatements (32.1)
Minority interests (4.3)
Net income (attributable to Schneider Electric SA) - IFRS - Dec. 31, 2004 823.9
Consolidated financial statements