APC 2004 Annual Report Download - page 120
Download and view the complete annual report
Please find page 120 of the 2004 APC annual report below. You can navigate through the pages in the report by either clicking on the pages listed below, or by using the keyword search tool below to find specific information within the annual report.-
 1
1 -
2
-
3
-
4
-
5
-
6
-
7
-
8
-
9
-
10
-
11
-
12
-
13
-
14
-
15
-
16
-
17
-
18
-
19
-
20
-
21
-
22
-
23
-
24
-
25
-
26
-
27
-
28
-
29
-
30
-
31
-
32
-
33
-
34
-
35
-
36
-
37
-
38
-
39
-
40
-
41
-
42
-
43
-
44
-
45
-
46
-
47
-
48
-
49
-
50
-
51
-
52
-
53
-
54
-
55
-
56
-
57
-
58
-
59
-
60
-
61
-
62
-
63
-
64
-
65
-
66
-
67
-
68
-
69
-
70
-
71
-
72
-
73
-
74
-
75
-
76
-
77
-
78
-
79
-
80
-
81
-
82
-
83
-
84
-
85
-
86
-
87
-
88
-
89
-
90
-
91
-
92
-
93
-
94
-
95
-
96
-
97
-
98
-
99
-
100
-
101
-
102
-
103
-
104
-
105
-
106
-
107
-
108
-
109
-
 110
110 -
 111
111 -
 112
112 -
 113
113 -
 114
114 -
 115
115 -
 116
116 -
 117
117 -
 118
118 -
 119
119 -
 120
120 -
 121
121 -
 122
122 -
 123
123 -
 124
124 -
 125
125 -
 126
126 -
 127
127 -
 128
128 -
 129
129 -
 130
130 -
131
-
132
-
133
-
134
-
135
-
136
-
137
-
138
-
139
-
140
-
141
-
142
-
143
-
144
-
145
-
146
-
147
-
148
 |
 |

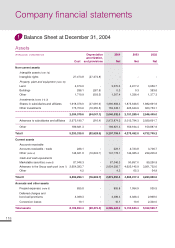
118
Assets
(
thousands, at December 31)
Depreciation 2004 2003 2002
amortization,
Cost and provisions Net Net Net
Non-current assets
Intangible assets
(note 1a)
Intangible rights 27,473.8 (27,473.8) - - -
Property, plant and equipment
(note 1b)
Land 3,670.6 - 3,670.6 3,917.2 3,959.7
Buildings 288.1 (287.8) 0.3 0.3 383.6
Other 1,710.9 (503.5) 1,207.4 1,336.4 1,377.3
Investments
(notes 2 & 3)
Shares in subsidiaries and affiliates 1,918,376.0 (37,691.6) 1,880,684.4 1,875,648.5 1,882,691.9
Other investments 175,703.6 (16,355.5) 159,348.1 225,640.9 663,753.1
2,094,079.6 (54,047.1) 2,040,032.5 2,101,289.4 2,546,445.0
Advances to subsidiaries and affiliates 2,973,190.7 (316.4) 2,972,874.3 2,012,784.3 2,029,691.7
Other 189,921.3 - 189,921.3 159,164.4 150,887.9
Total I 5,290,335.0 (82,628.6) 5,207,706.4 4,278,492.0 4,732,745.2
Current assets
Accounts receivable
Accounts receivable - trade 228.1 - 228.1 2,723.8 3,706.7
Other
(note 4)
148,621.8 (16,843.7) 131,778.1 146,385.4 239,205.6
Cash and cash equivalents
Marketable securities
(note 6)
87,046.3 - 87,046.3 90,697.0 89,250.8
A
dvances to the Group cash pool
(note 7)
2,654,393.7 - 2,654,393.7 4,625,145.9 3,951,732.0
Other 4.2 - 4.2 65.3 54.9
Total II 2,890,294.1 (16,843.7) 2,873,450.4 4,865,017.4 4,283,950.0
Accruals and other assets
Prepaid expenses
(note 5)
855.8 - 855.8 1,094.9 535.5
Deferred charges and
bond call premiums 4,399.3 - 4,399.3 6,028.4 2,968.0
Conversion losses 10.1 - 10.1 10.6 2,330.0
Total assets 8,185,894.3 (99,472.3) 8,086,422.0 9,150,643.3 9,022,528.7
1
Balance Sheet at December 31, 2004
Company financial statements