APC 2004 Annual Report Download - page 6
Download and view the complete annual report
Please find page 6 of the 2004 APC annual report below. You can navigate through the pages in the report by either clicking on the pages listed below, or by using the keyword search tool below to find specific information within the annual report.-
 1
1 -
 2
2 -
 3
3 -
 4
4 -
 5
5 -
 6
6 -
 7
7 -
 8
8 -
 9
9 -
 10
10 -
 11
11 -
 12
12 -
 13
13 -
 14
14 -
 15
15 -
 16
16 -
 17
17 -
18
-
19
-
20
-
21
-
22
-
23
-
24
-
25
-
26
-
27
-
28
-
29
-
30
-
31
-
32
-
33
-
34
-
35
-
36
-
37
-
38
-
39
-
40
-
41
-
42
-
43
-
44
-
45
-
46
-
47
-
48
-
49
-
50
-
51
-
52
-
53
-
54
-
55
-
56
-
57
-
58
-
59
-
60
-
61
-
62
-
63
-
64
-
65
-
66
-
67
-
68
-
69
-
70
-
71
-
72
-
73
-
74
-
75
-
76
-
77
-
78
-
79
-
80
-
81
-
82
-
83
-
84
-
85
-
86
-
87
-
88
-
89
-
90
-
91
-
92
-
93
-
94
-
95
-
96
-
97
-
98
-
99
-
100
-
101
-
102
-
103
-
104
-
105
-
106
-
107
-
108
-
109
-
110
-
111
-
112
-
113
-
114
-
115
-
116
-
117
-
118
-
119
-
120
-
121
-
122
-
123
-
124
-
125
-
126
-
127
-
128
-
129
-
130
-
131
-
132
-
133
-
134
-
135
-
136
-
137
-
138
-
139
-
140
-
141
-
142
-
143
-
144
-
145
-
146
-
147
-
148
 |
 |

4
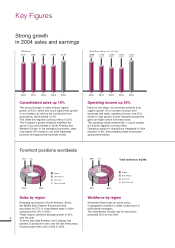
Key Figures
9.70
2000
9.83
2001
9.06
2002
8.78
2003
10.37
2004
( billion)
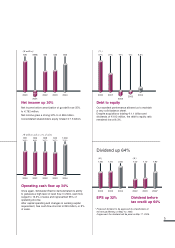
Consolidated sales up 18%
The strong increase in sales reflects organic
growth of 8.5%, which was much higher than growth
in our markets, as well as the contribution from
acquisitions, which added 13.4%.
This offset the negative currency effect of 3.8%.
The Company's growth initiatives amplified the
upturn in our end markets in North America and
Western Europe. In the emerging economies, sales
rose nearly 20% thanks to our solid leadership
positions and appropriate business model.
1,298
2000
1,116
2001
1,040
2002
1,007
2003
1,311
2004
( million and as a % of sales)
13.4%11.4%11.5%11.5%12.6%
Operating income up 30%
Here too, the sharp rise stemmed primarily from
organic growth. On a constant structure and
exchange rate basis, operating income rose 25%
thanks to high growth, further industrial productivity
gains and tight control over base costs.
The operating margin widened by 1.1 point despite
a 0.6-point negative currency effect.
Operating margin for acquisitions integrated in 2004
reached 12.9%, demonstrating these businesses'
quality performance.
24%52%
7%
17%
Europe
North America
Asia-Pacific
Rest of the world
Europe
North America
Asia-Pacific
Rest of the world
21%
7%
54%
18%
Sales by region
Emerging economies in South America, Africa,
the Middle East, Eastern Europe and Asia
accounted for 27% of consolidated sales in 2004
compared with 20% in 2001.
These regions achieved average growth of 20%
over the year.
To serve their high demand, the Company has
opened 23 production sites over the last three years,
including eight new units in Asia in 2004.
Workforce by region
Schneider Electric has an active policy
of geographic mobility to create a talent pool of
multicultural managers.
The international mobility rate for executives
exceeded 35% at end 2004.
Strong growth
in 2004 sales and earnings
Forefront positions worldwide
Total workforce: 84,866