APC 2004 Annual Report Download - page 63
Download and view the complete annual report
Please find page 63 of the 2004 APC annual report below. You can navigate through the pages in the report by either clicking on the pages listed below, or by using the keyword search tool below to find specific information within the annual report.-
 1
1 -
2
-
3
-
4
-
5
-
6
-
7
-
8
-
9
-
10
-
11
-
12
-
13
-
14
-
15
-
16
-
17
-
18
-
19
-
20
-
21
-
22
-
23
-
24
-
25
-
26
-
27
-
28
-
29
-
30
-
31
-
32
-
33
-
34
-
35
-
36
-
37
-
38
-
39
-
40
-
41
-
42
-
43
-
44
-
45
-
46
-
47
-
48
-
49
-
50
-
51
-
52
-
 53
53 -
 54
54 -
 55
55 -
 56
56 -
 57
57 -
 58
58 -
 59
59 -
 60
60 -
 61
61 -
 62
62 -
 63
63 -
 64
64 -
 65
65 -
 66
66 -
 67
67 -
 68
68 -
 69
69 -
 70
70 -
 71
71 -
 72
72 -
 73
73 -
74
-
75
-
76
-
77
-
78
-
79
-
80
-
81
-
82
-
83
-
84
-
85
-
86
-
87
-
88
-
89
-
90
-
91
-
92
-
93
-
94
-
95
-
96
-
97
-
98
-
99
-
100
-
101
-
102
-
103
-
104
-
105
-
106
-
107
-
108
-
109
-
110
-
111
-
112
-
113
-
114
-
115
-
116
-
117
-
118
-
119
-
120
-
121
-
122
-
123
-
124
-
125
-
126
-
127
-
128
-
129
-
130
-
131
-
132
-
133
-
134
-
135
-
136
-
137
-
138
-
139
-
140
-
141
-
142
-
143
-
144
-
145
-
146
-
147
-
148
 |
 |

2
61
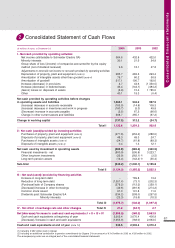
Consolidated Statement of Cash Flows
(in millions of euros, at December 31)
2004 2003 2002
I - Net cash provided by operating activities
Net income (attributable to Schneider Electric SA) 564.6 432.8 422.0
Minority interests 30.1 21.5 24.9
Group share of loss/(income) of companies accounted for by the equity
method (net of dividend received) 3.6 18.1 27.8
Adjustments to reconcile net income to net cash provided by operating activities:
Depreciation of property, plant and equipment
(note 5)
285.7 283.5 293.4
Amortization of intangible assets other than goodwill
(note 4)
76.7 60.2 56.9
Amortization of goodwill 217.1 190.7 192.6
Increase (decrease) in provisions 4.7 44.6 (1 350.5)
Increase (decrease) in deferred taxes 46.4 (144.1) (484.2)
(Gains) losses on disposals of assets (8.9) 15.4 1 785.0
Other 40.1 19.3 (0.4)
Net cash provided by operating activities before changes
in operating assets and liabilities 1,260.1 942.0 967.5
(Increase) decrease in accounts receivable (183.0) (14.8) 109.3
(Increase) decrease in inventories and work in progress (160.7) (5.3) 49.8
(Decrease) increase in accounts payable (2.5) 67.2 (96.6)
Change in other current assets and liabilities 208.7 265.1 (97.2)
Change in working capital (137.5) 312.2 (34.7)
Total I 1,122.6 1,254.2 932.8
II - Net cash (used)/provided by investing activities
Purchases of property, plant and equipment
(note 5)
(277.8) (253.2) (288.0)
Disposals of property, plant and equipment
(note 5)
48.3 48.3 24.7
Purchases of intangible assets
(note 4)
(54.7) (61.8) (89.3)
Disposals of intangible assets
(note 4)
0.4 1.3 12.1
Net cash used by investment in operating assets (283.8) (265.4) (340.5)
Financial investments - net (800.9) (595.8) 3 223.7
Other long-term investments (25.9) (262.1) (1) (2.5)
Long-term pension assets (13.4) (142.2) (2) (55.4)
Sub-total (840.2) (1,000.1) 3,165.8
Total II (1,124.0) (1,265.5) 2,825.3
III -
Net cash (used) / provided by financing activities
Increase in long-term debt - 789.8 13.2
Reduction of long-term debt (1,351.4) (73.1) (202.3)
(Purchase)/sale of Company shares (278.2) (112.3) (329.1)
(Decrease)/increase in other borrowings (49.6) (481.6) (274.2)
Common stock issued 61.0 101.8 11.0
Dividends paid: Schneider Electric SA (334.2) (308.0) (297.6)
Minority interests (23.3) (18.6) (18.3)
Total III (1,975.7) (102.0) (1,097.3)
IV - Net effect of exchange rate and other changes Total IV 21.2 (54.7) 2.7
Net (decrease)/increase in cash and cash equivalents: I + II + III + IV (1,955.9) (168.0) 2,663.5
Cash and cash equivalents at beginning of year 2,902.4 3,070.4 406.9
(Decrease)/increase in cash and cash equivalents (1,955.9) (168.0) 2,663.5
Cash and cash equivalents at end of year
(note 13)
946.5 2,902.4 3,070.4
(1) Including
259 million loan to Clipsal.
(2) Including an additional contribution to pension commitments by Square D in an amount of
143 million in 2003 vs.
50 million in 2002.
The accompanying notes are an integral part of the consolidated financial statements.
Consolidated financial statements