APC 2004 Annual Report Download - page 24
Download and view the complete annual report
Please find page 24 of the 2004 APC annual report below. You can navigate through the pages in the report by either clicking on the pages listed below, or by using the keyword search tool below to find specific information within the annual report.-
 1
1 -
2
-
3
-
4
-
5
-
6
-
7
-
8
-
9
-
10
-
11
-
12
-
13
-
 14
14 -
 15
15 -
 16
16 -
 17
17 -
 18
18 -
 19
19 -
 20
20 -
 21
21 -
 22
22 -
 23
23 -
 24
24 -
 25
25 -
 26
26 -
 27
27 -
 28
28 -
 29
29 -
 30
30 -
 31
31 -
 32
32 -
 33
33 -
 34
34 -
35
-
36
-
37
-
38
-
39
-
40
-
41
-
42
-
43
-
44
-
45
-
46
-
47
-
48
-
49
-
50
-
51
-
52
-
53
-
54
-
55
-
56
-
57
-
58
-
59
-
60
-
61
-
62
-
63
-
64
-
65
-
66
-
67
-
68
-
69
-
70
-
71
-
72
-
73
-
74
-
75
-
76
-
77
-
78
-
79
-
80
-
81
-
82
-
83
-
84
-
85
-
86
-
87
-
88
-
89
-
90
-
91
-
92
-
93
-
94
-
95
-
96
-
97
-
98
-
99
-
100
-
101
-
102
-
103
-
104
-
105
-
106
-
107
-
108
-
109
-
110
-
111
-
112
-
113
-
114
-
115
-
116
-
117
-
118
-
119
-
120
-
121
-
122
-
123
-
124
-
125
-
126
-
127
-
128
-
129
-
130
-
131
-
132
-
133
-
134
-
135
-
136
-
137
-
138
-
139
-
140
-
141
-
142
-
143
-
144
-
145
-
146
-
147
-
148
 |
 |

22
6
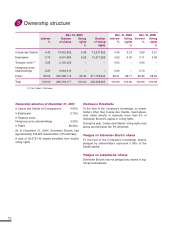
Stock market data
The Schneider Electric SA share is listed on the
Euronext First Market in Paris, where it is traded in
lots of one under ISIN code FR0000121972.
It is part of the market's benchmark CAC 40 index of
France's largest stocks.
Five-year Summary of Share-Price Performance
2004 2003 2002 2001 2000
Average daily trading volume
Euronext Paris
- Thousands of shares 942.82 1,198.06 1,068.17 1,206.92 528.64
- Millions of euros 50.49 53.92 53.87 72.82 38.50
High and low share prices (in euros)
- High 58.25 54.30 59.85 79.20 85.80
- Low 49.20 37.40 37.16 38.10 57.35
Year-end closing price (in euros) 51.20 51.90 45.09 54.00 77.70
Yield including tax credit (%) 3.52 3.18 3.33 2.41 3.09
18-Month Trading Data
Year Month Trading Value Price (in euros)
volume (in millions
(in thousands of euros)
of shares) High Low
2003 September 22,939 1,108.11 51.00 44.50
October 20,399 966.40 50.60 44.60
November 24,354 1,252.56 53.00 49.70
December 18,842 990.11 54.30 51.20
2004 January 26,457 1,394.70 55.95 49.71
February 20,016 1,068.16 55.30 51.50
March 26,179 1,379.00 54.35 50.30
April 24,626 1,381.67 58.25 53.40
May 26,499 1,464.98 57.20 52.75
June 19,087 1,063.22 56.65 54.45
July 16,285 874.93 56.45 51.70
August 16,546 845.08 53.10 49.20
September 17,027 891.51 53.70 51.30
October 16,856 896.23 54.70 51.30
November 15,184 807.22 54.30 51.80
December 18,283 938.94 52.60 49.71
Total 2004 243,045 13,005.64
2005 January 29,490 1,645.42 58.60 51.15
February 18,851 1,113.54 60.60 57.65