APC 2004 Annual Report Download - page 7
Download and view the complete annual report
Please find page 7 of the 2004 APC annual report below. You can navigate through the pages in the report by either clicking on the pages listed below, or by using the keyword search tool below to find specific information within the annual report.-
 1
1 -
 2
2 -
 3
3 -
 4
4 -
 5
5 -
 6
6 -
 7
7 -
 8
8 -
 9
9 -
 10
10 -
 11
11 -
 12
12 -
 13
13 -
 14
14 -
 15
15 -
 16
16 -
 17
17 -
 18
18 -
19
-
20
-
21
-
22
-
23
-
24
-
25
-
26
-
27
-
28
-
29
-
30
-
31
-
32
-
33
-
34
-
35
-
36
-
37
-
38
-
39
-
40
-
41
-
42
-
43
-
44
-
45
-
46
-
47
-
48
-
49
-
50
-
51
-
52
-
53
-
54
-
55
-
56
-
57
-
58
-
59
-
60
-
61
-
62
-
63
-
64
-
65
-
66
-
67
-
68
-
69
-
70
-
71
-
72
-
73
-
74
-
75
-
76
-
77
-
78
-
79
-
80
-
81
-
82
-
83
-
84
-
85
-
86
-
87
-
88
-
89
-
90
-
91
-
92
-
93
-
94
-
95
-
96
-
97
-
98
-
99
-
100
-
101
-
102
-
103
-
104
-
105
-
106
-
107
-
108
-
109
-
110
-
111
-
112
-
113
-
114
-
115
-
116
-
117
-
118
-
119
-
120
-
121
-
122
-
123
-
124
-
125
-
126
-
127
-
128
-
129
-
130
-
131
-
132
-
133
-
134
-
135
-
136
-
137
-
138
-
139
-
140
-
141
-
142
-
143
-
144
-
145
-
146
-
147
-
148
 |
 |
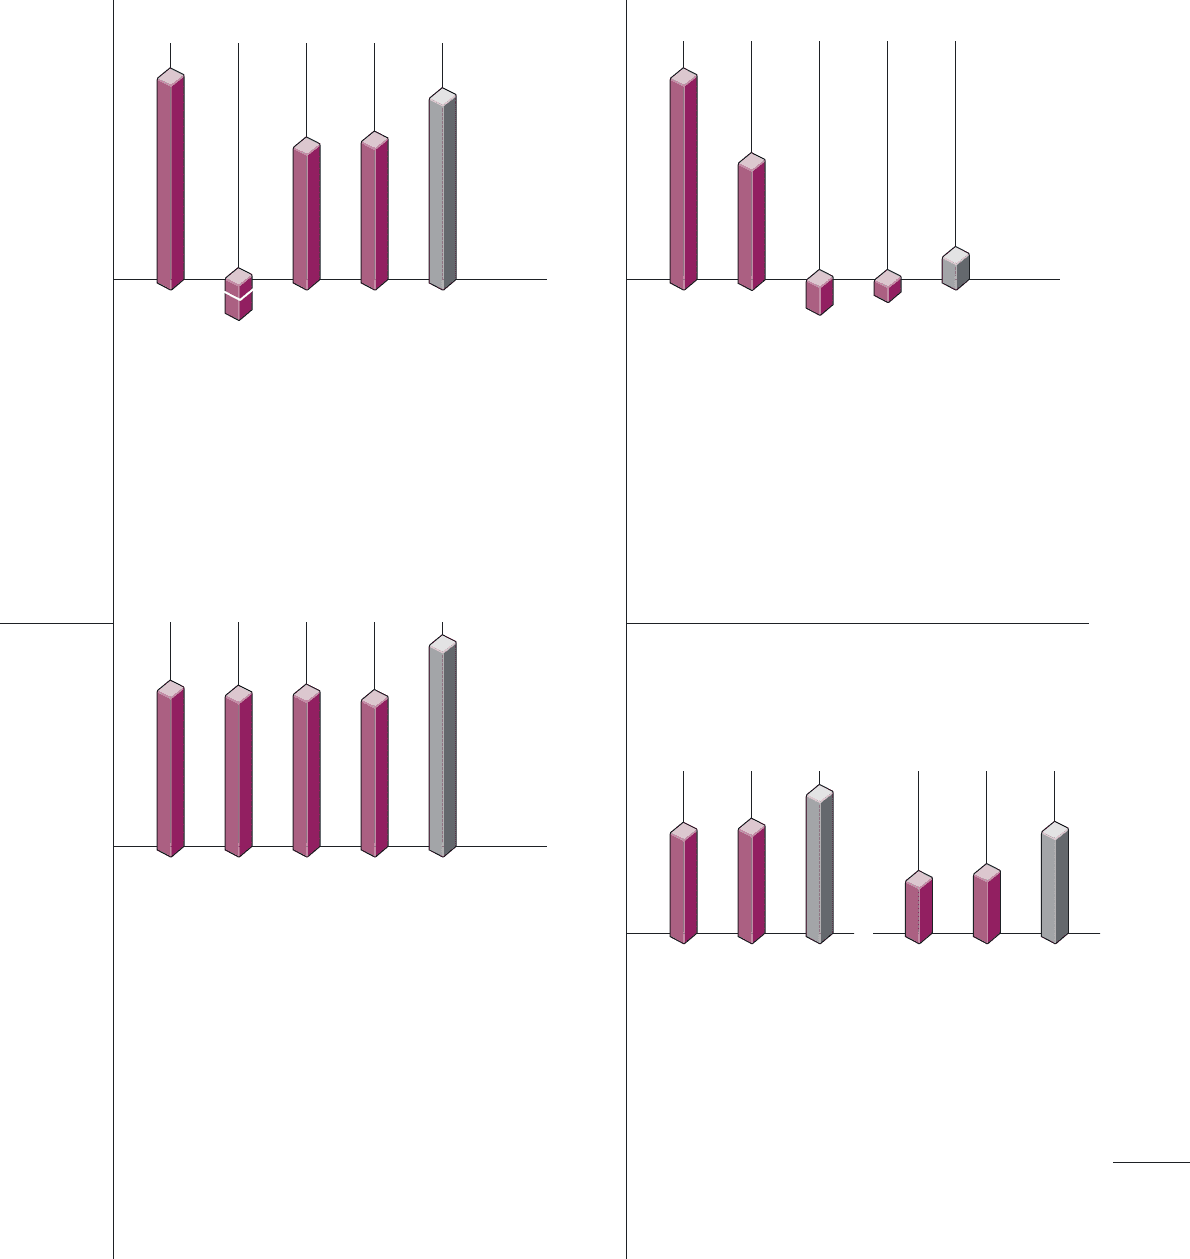
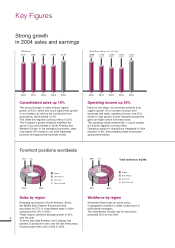
5
991
2000
966
2001
968
2002
942
2003
1,260
2004
( million and as a % of sales)
10.2%9.8% 10.7%10.7%12.2%
Operating cash flow up 34%
Once again, Schneider Electric demonstrated its ability
to generate a high level of cash flow. In 2004, cash flow
surged to 12.2% of sales and represented 96% of
operating income.
After capital spending and changes in working capital
requirement, free cash flow stood at 839 million, or 8%
of sales.
625
2000
(986)
2001
422
2002
433
2003
565
2004
( million)
Net income up 30%
Net income before amortization of goodwill rose 25%
to 782 million.
Net income grew a strong 30% to 565 million.
Consolidated shareholders equity totaled 7.6 billion.
1.85
2002
1.94
2003
2.56
2004
()
1.00
2002
1.10
2003
1.80
2004*
()
EPS up 32%
47%
2000
27%
2001
-11%
2002
-5%
2003
6.3%
2004
(%)
Debt to equity
Our excellent performance allowed us to maintain
a very solid balance sheet.
Despite acquisitions totaling 1.1 billion and
dividends of 612 million, the debt to equity ratio
remained low at 6.3%.
Dividend before
tax credit up 64%
* Proposed dividend to be approved by shareholders at
the Annual Meeting on May 12, 2005.
If approved, the dividend will be paid on May 17, 2005.
Dividend up 64%