American Airlines 1999 Annual Report Download - page 21
Download and view the complete annual report
Please find page 21 of the 1999 American Airlines annual report below. You can navigate through the pages in the report by either clicking on the pages listed below, or by using the keyword search tool below to find specific information within the annual report.-
 1
1 -
2
-
3
-
4
-
5
-
6
-
7
-
8
-
9
-
10
-
 11
11 -
 12
12 -
 13
13 -
 14
14 -
 15
15 -
 16
16 -
 17
17 -
 18
18 -
 19
19 -
 20
20 -
 21
21 -
 22
22 -
 23
23 -
 24
24 -
 25
25 -
 26
26 -
 27
27 -
 28
28 -
 29
29 -
 30
30 -
 31
31 -
32
-
33
-
34
-
35
-
36
-
37
-
38
-
39
-
40
-
41
-
42
-
43
-
44
-
45
-
46
-
47
-
48
-
49
-
50
-
51
-
52
-
53
-
54
-
55
-
56
-
57
-
58
-
59
-
60
-
61
-
62
-
63
-
64
-
65
-
66
-
67
 |
 |
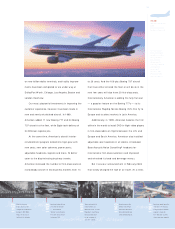
cents per passenger mile — declined 2.7 percent. As a
result, revenue per available seat mile, which is the best
indicator of revenue performance, fell by 3.6 percent.
It was 3 percent lower in the United States and 5.2
percent lower in international markets.
However, by the fourth quarter, we started to see
positive trends developing in international markets.
The most notable improvement was in Europe, where
revenue per available seat mile increased after several
quarters of double-digit declines.
On the cost front, the price of fuel — one of
every airline’s biggest expenses — was virtually
unchanged versus 1998, even though prices did spike
in the fourth quarter and continue to increase in
2000. Fuel cost the airline an average of 54.9 cents
per gallon in 1998 and 54.8 cents per gallon in 1999.
The year-over-year comparison would have been
worse had it not been for the fuel hedging the
company did in late 1998 and early 1999.
Still, American’s total cost per available seat
mile increased from 9.25 cents in 1998 to 9.39
cents in 1999.
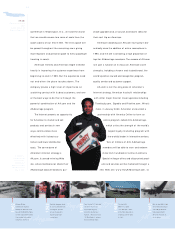
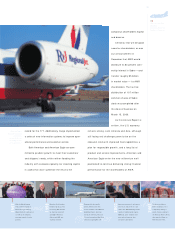
The performance of American Eagle, AMR’s
regional airline, was also affected by some unique
factors that make year-over-year comparisons a chal-
lenge. Eagle’s capacity, or total available seat miles,
increased more than 25 percent with the acquisition
of Business Express, a leading regional carrier in the
northeastern United States. And Eagle’s results were
positively impacted by the dramatic, ongoing transfor-
mation of its fleet. By year’s end, Eagle had deployed
45 new 50-seat regional jets and nine new 37-seat jets.
19
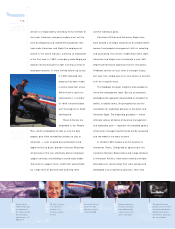
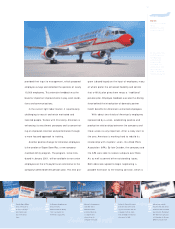
Sup e r ATR
Manufacturer:
Aerospatiale (France)
Number in Fleet: 43
Number of Seats: 64/66
1987
1988
1989
1990
1991
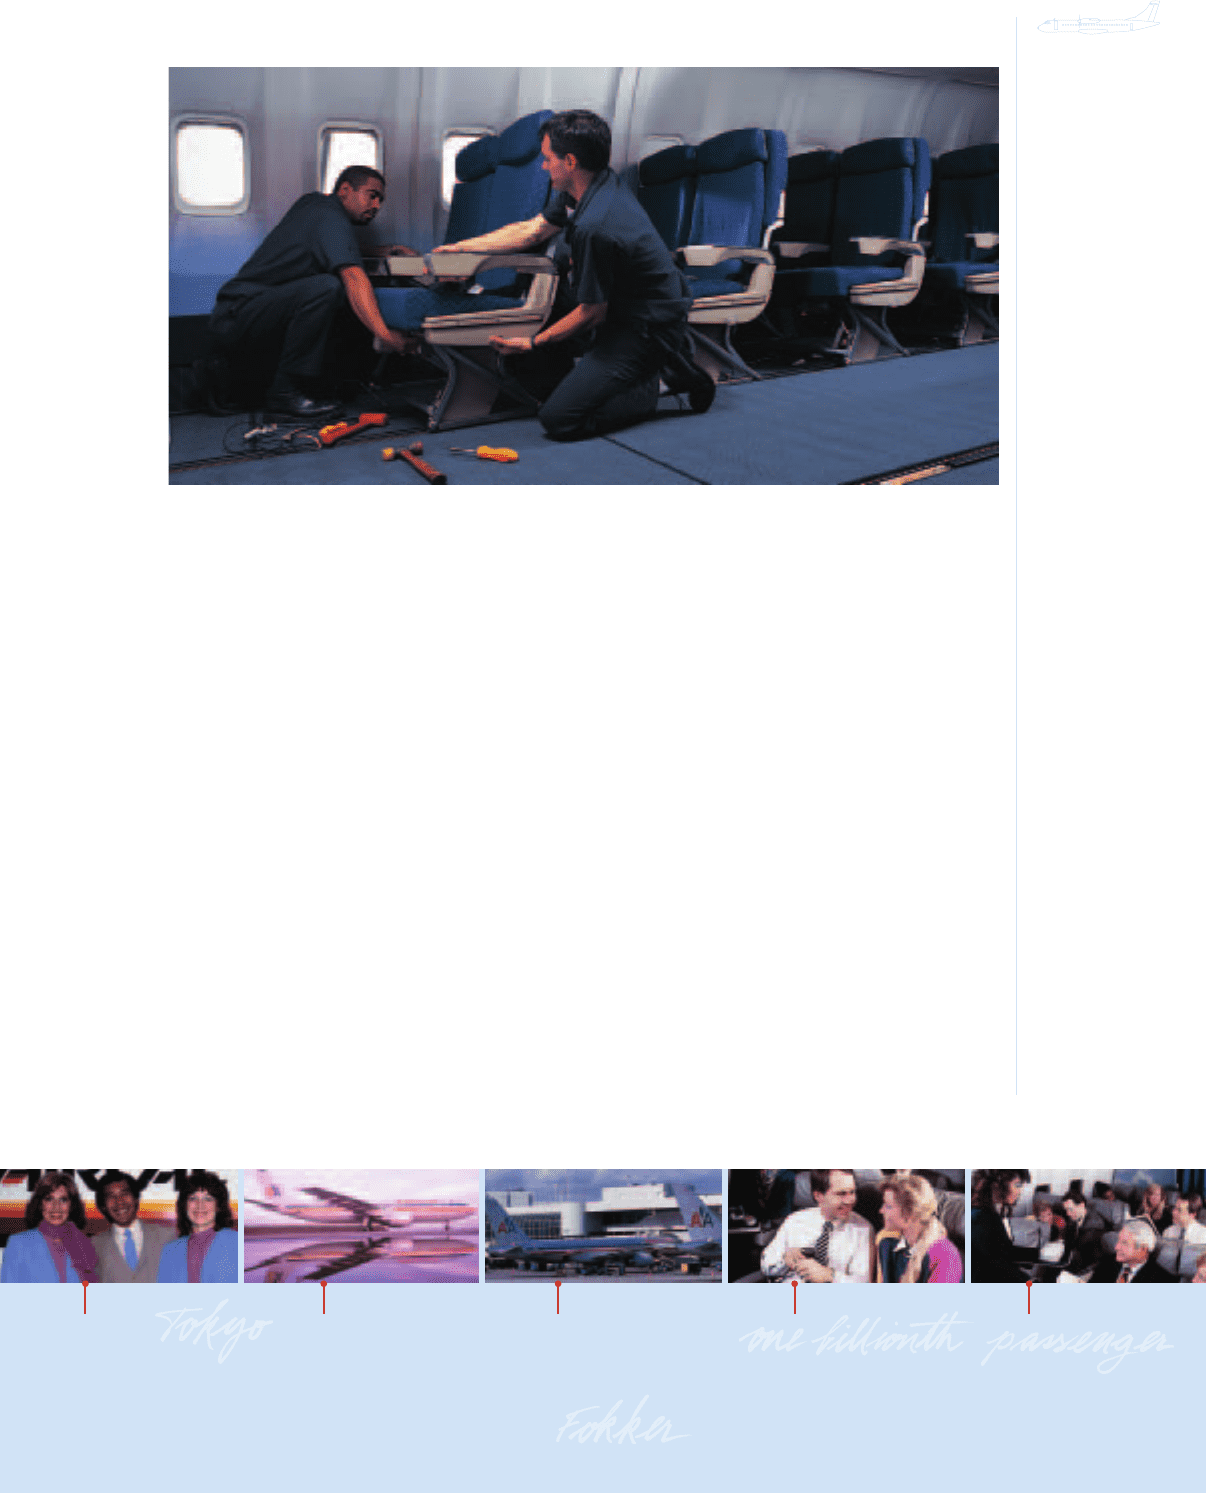
American merges with
West Coast airline AirCal
and launches service from
Dallas/Fort Worth to Tokyo.
American adds service
from New York (JFK) to
Zurich, Dallas/Fort Worth to
Madrid and Raleigh/Durham
to Paris and strengthens
Caribbean service by
ordering A300s.
Miami becomes the
airline’s newest hub, as
American continues to build
its fleet — adding its first
757s and ordering MD-11s
and Fokker 100s.
Acquiring Eastern Airlines’
Central and South
American routes,
American begins serving
20 cities in the region.
American flies its one
billionth passenger and
launches its latest
European expansion
with routes purchased
from TWA.
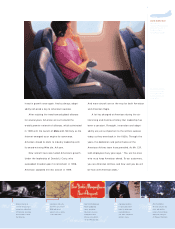
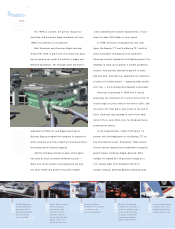
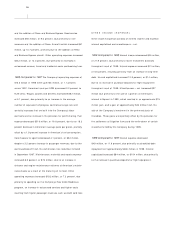
By removing 7,200
seats — roughly
two rows per plane
— American is pro-
viding more room
throughout coach.