American Airlines 1999 Annual Report Download - page 40
Download and view the complete annual report
Please find page 40 of the 1999 American Airlines annual report below. You can navigate through the pages in the report by either clicking on the pages listed below, or by using the keyword search tool below to find specific information within the annual report.-
 1
1 -
2
-
3
-
4
-
5
-
6
-
7
-
8
-
9
-
10
-
11
-
12
-
13
-
14
-
15
-
16
-
17
-
18
-
19
-
20
-
21
-
22
-
23
-
24
-
25
-
26
-
27
-
28
-
29
-
 30
30 -
 31
31 -
 32
32 -
 33
33 -
 34
34 -
 35
35 -
 36
36 -
 37
37 -
 38
38 -
 39
39 -
 40
40 -
 41
41 -
 42
42 -
 43
43 -
 44
44 -
 45
45 -
 46
46 -
 47
47 -
 48
48 -
 49
49 -
 50
50 -
51
-
52
-
53
-
54
-
55
-
56
-
57
-
58
-
59
-
60
-
61
-
62
-
63
-
64
-
65
-
66
-
67
 |
 |

AMR CORPORATION
39
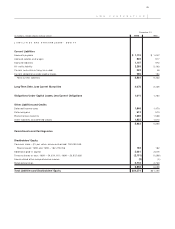
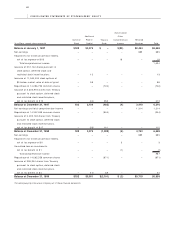
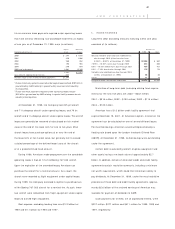
CONSOLIDATED STATEMENTS OF CASH FLOWS
Year Ended December 31,
(in millions) 1999 1998 1997
Cash Flow from Operating Activities:
Income from continuing operations $ 656 $ 1,114 $ 809
Adjustments to reconcile income from continuing operations to net cash
provided by operating activities:
Depreciation 864 830 831
Amortization 228 210 209
Deferred income taxes 183 268 321
Gain on sale of other investments, net (95) ––
Gain on disposition of equipment and property (15) (19) (24)
Change in assets and liabilities:
Decrease (increase) in receivables 261 (185) 72
Increase in inventories (140) (36) (41)
Increase in accounts payable and accrued liabilities 42 345 64
Increase in air traffic liability 89 119 155
Other, net 191 151 127
Net cash provided by operating activities 2,264 2,797 2,523
Cash Flow from Investing Activities:
Capital expenditures, including purchase deposits on flight equipment (3,539) (2,342) (1,139)
Net decrease (increase) in short-term investments (253) 348 (480)
Acquisitions and other investments (99) (137) –
Proceeds from:
Sale of discontinued operations 259 ––
Sale of other investments 85 ––
Sale of equipment and property 79 262 291
Other 18 ––
Net cash used for investing activities (3,450) (1,869) (1,328)
Cash Flow from Financing Activities:
Repurchase of common stock (871) (945) (740)
Payments on long-term debt and capital lease obligations (280) (547) (648)
Proceeds from:
Issuance of long-term debt 1,956 246 –
Short-term loan from affiliate 300 ––
Sale-leaseback transactions 54 270 –
Exercise of stock options 25 85 200
Net cash provided by (used for) financing activities 1,184 (891) (1,188)
Net increase (decrease) in cash (2) 37 7
Cash at beginning of year 87 50 43
Cash at end of year $ 85 $ 87 $ 50
Activities Not Affecting Cash
Payment of short-term loan from affiliate against receivable from affiliate $ 300 $ – $ –
Capital lease obligations incurred $ 54 $ 270 $ –
The accompanying notes are an integral part of these financial statements.