American Airlines 1999 Annual Report Download - page 3
Download and view the complete annual report
Please find page 3 of the 1999 American Airlines annual report below. You can navigate through the pages in the report by either clicking on the pages listed below, or by using the keyword search tool below to find specific information within the annual report.-
 1
1 -
 2
2 -
 3
3 -
 4
4 -
 5
5 -
 6
6 -
 7
7 -
 8
8 -
 9
9 -
 10
10 -
 11
11 -
 12
12 -
 13
13 -
 14
14 -
15
-
16
-
17
-
18
-
19
-
20
-
21
-
22
-
23
-
24
-
25
-
26
-
27
-
28
-
29
-
30
-
31
-
32
-
33
-
34
-
35
-
36
-
37
-
38
-
39
-
40
-
41
-
42
-
43
-
44
-
45
-
46
-
47
-
48
-
49
-
50
-
51
-
52
-
53
-
54
-
55
-
56
-
57
-
58
-
59
-
60
-
61
-
62
-
63
-
64
-
65
-
66
-
67
 |
 |

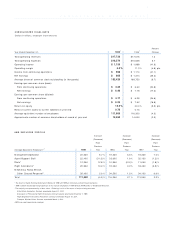
CONSOLIDATED HIGHLIGHTS
1
CONSOLI DATED HIGHLIGHTS
(Dollars in millions, except per share amounts)
Percent
Year Ended December 31, 1999119981Change
Total operating revenues $17,730 $17,516 1.2
Total operating expenses $16,574 $15,528 6.7
Operating income $ 1,156 $ 1,988 (41.9)
Operating margin 6.5 11.3 (4.8) pts.
Income from continuing operations $ 656 $ 1,114 (41.1)
Net earnings $ 985 $ 1,314 (25.0)
Average shares of common stock outstanding (in thousands) 152,420 168,750 (9.7)
Earnings per common share (basic)
From continuing operations $ 4.30 $ 6.60 (34.8)
Net earnings $ 6.46 $ 7.78 (17.0)
Earnings per common share (diluted)
From continuing operations $ 4.17 $ 6.38 (34.6)
Net earnings $ 6.26 $ 7.52 (16.8)
Return on equity 14.5 20.4 (5.9) pts.
Ratio of current assets to current liabilities at year-end 0.75 0.75 –
Average equivalent number of employees 111,600 116,300 (4.0)
Approximate number of common shareholders of record at year-end 13,650 14,000 (2.5)
AMR EMPLOYEE PROFI LE
Increase/ Increase/ Increase/
(Decrease) (Decrease) (Decrease)
From From From
Previous Previous Previous
Average Equivalent Headcount 21999 Year 1998 Year 1997 Year
Management/Specialist 20,600 6.7 19,300 5.5 18,300 7.0
Agent/Support Staff 22,400 (31.3) 32,600 1.6 32,100 (1.2)
Pilots* 12,300 12.8 10,900 (0.9) 11,000 (1.8)
Flight Attendants* 20,900 10.0 19,000 3.3 18,400 (0.5)
Mechanics, Ramp Service,
Other Ground Personnel* 35,400 2.6 34,500 1.2 34,100 6.6
Total 111,600 (4.0) 116,300 2.1 113,900 2.3
1The results of Sabre Holdings Corporation (Sabre) for 1999 and 1998 are reflected as discontinued operations.
21999 numbers include Sabre employees but do not include employees of AMR Services, AMR Combs or TeleService Resources.
*The majority are represented by a labor union. Following is a list of the status of major existing contracts:
Allied Pilots Association. Contract amendable August 31, 2001.
Association of Professional Flight Attendants. Contract became amendable November 1, 1998.
Flight Engineers International Association. Contract amendable August 31, 2001.
Transport Workers Union. Contract amendable March 1, 2001.
AMR is an equal opportunity employer.
%
%
%
%
%
%
%
%
%
%
%
%
%
%
%
%
%
%
%
%
%
%