American Airlines 1999 Annual Report Download - page 56
Download and view the complete annual report
Please find page 56 of the 1999 American Airlines annual report below. You can navigate through the pages in the report by either clicking on the pages listed below, or by using the keyword search tool below to find specific information within the annual report.-
 1
1 -
2
-
3
-
4
-
5
-
6
-
7
-
8
-
9
-
10
-
11
-
12
-
13
-
14
-
15
-
16
-
17
-
18
-
19
-
20
-
21
-
22
-
23
-
24
-
25
-
26
-
27
-
28
-
29
-
30
-
31
-
32
-
33
-
34
-
35
-
36
-
37
-
38
-
39
-
40
-
41
-
42
-
43
-
44
-
45
-
 46
46 -
 47
47 -
 48
48 -
 49
49 -
 50
50 -
 51
51 -
 52
52 -
 53
53 -
 54
54 -
 55
55 -
 56
56 -
 57
57 -
 58
58 -
 59
59 -
 60
60 -
 61
61 -
 62
62 -
 63
63 -
 64
64 -
 65
65 -
 66
66 -
67
 |
 |

AMR CORPORATION
55
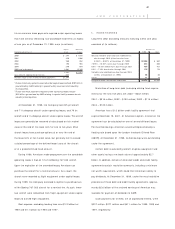
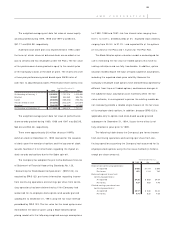
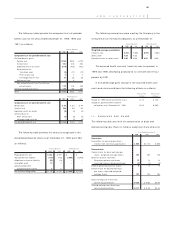
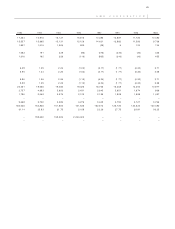
The following tables provide the components of net periodic
benefit cost for the years ended December 31, 1999, 1998 and
1997 (in millions):
Pension Benefits
1999 1998 1997
Components of net periodic benefit cost
Defined benefit plans:
Service cost $236 $213 $179
Interest cost 433 418 393
Expected return on assets (514) (478) (421)
Amortization of:
Transition asset (4) (11) (12)
Prior service cost 544
Unrecognized net loss 21 22 26
Settlement loss –6–
Net periodic benefit cost for defined
benefit plans 177 174 169
Defined contribution plans 155 158 145
Total $332 $332 $314
Other Benefits
1999 1998 1997
Components of net periodic benefit cost
Service cost $ 56 $ 52 $ 44
Interest cost 108 99 92
Expected return on assets (6) (5) (4)
Amortization of:
Prior service cost (5) (5) (5)
Unrecognized net gain –(2) (9)
Net periodic benefit cost $153 $139 $118
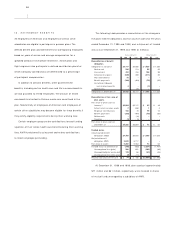
The following table provides the amounts recognized in the
consolidated balance sheets as of December 31, 1999 and 1998
(in millions):
Pension Benefits Other Benefits
1999 1998 1999 1998
Prepaid benefit cost $244 $ 297 $ – $ –
Accrued benefit liability (170) (142) (1,669) (1,598)
Additional minimum liability (15) (13) ––
Intangible asset 13 7––
Accumulated other
comprehensive income 26––
Net amount recognized $ 74 $ 155 $(1,669) $(1,598)
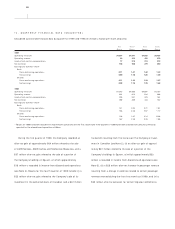
The following assumptions were used by the Company in the
measurement of the benefit obligation as of December 31:
Pension Benefits Ot her Benefits
1999 1998 1999 1998
Weighted-average assumptions
Discount rate 8.25% 7.00% 8.25% 7.00%
Salary scale 4.26 4.26 ––
Expected return on plan assets 9.50 9.50 9.50 9.50
The assumed health care cost trend rate was five percent in
1999 and 1998, decreasing gradually to an ultimate rate of four
percent by 2001.
A one percentage point change in the assumed health care
cost trend rates would have the following effects (in millions):
One percent One percent
increase decrease
Impact on 1999 service and interest cost $ 24 $ (22)
Impact on postretirement benefit
obligation as of December 31, 1999 $115 $(105)
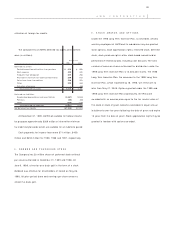
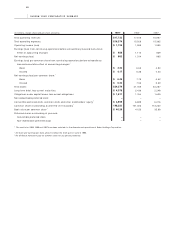
11. EARNINGS PER SHARE
The following table sets forth the computation of basic and
diluted earnings per share (in millions, except per share amounts):
Year Ended December 31,
1999 1998 1997
Numerator:
Numerator for earnings per share –
income from continuing operations $ 656 $1,114 $ 809
Denominator:
Denominator for basic earnings per
share – weighted-average shares 152 169 178
Effect of dilutive securities:
Employee options and shares 12 13 14
Assumed treasury shares purchased (7) (7) (9)
Dilutive potential common shares 565
Denominator for diluted earnings
per share – adjusted weighted-
average shares 157 175 183
Basic earnings per share from
continuing operations $4.30 $ 6.60 $4.54
Diluted earnings per share from
continuing operations $4.17 $ 6.38 $4.43